


International students have long been a cornerstone of the U.S. higher education system, contributing not only tuition revenue but also research capacity, workforce development, and global academic exchange. For decades, the United States has ranked among the world’s leading destinations for students seeking degrees abroad, supported by a network of universities, research institutions, and vocational programs. To study in the United States, most foreign nationals must obtain a student visa—typically either an F visa for academic study or an M visa for vocational training.
In recent years, however, the landscape for international students studying in the U.S. has become more challenging. New policy changes—including mandatory in-person interviews and thorough vetting of social media profiles—have introduced new uncertainty for prospective students. At the same time, interest in international education is growing in Europe and certain Asian countries, indicating increased competition for U.S. educational institutions.
To better understand these trends, researchers from Manifest Law—a modern immigration law firm focusing on immigration visas—analyzed U.S. Department of Homeland Security F-1 and M-1 visa data to extract insights about where international students in the U.S. are studying, where they’re coming from, and how these trends are changing over time.
Here are the key takeaways from the analysis:
- More than 90% of international students are in higher education. Over 1.1 million students are enrolled in postsecondary programs, including 512,841 in master’s, 351,908 in bachelor’s, and 188,184 in doctoral programs.
- Nearly half of all international students in the U.S. come from India and China. India (350,237 students) and China (229,463) dominate enrollment, far outpacing the next closest country South Korea (42,160).
- Enrollment peaked in 2025 and is now leveling off. International student totals reached 1,325,800 in March 2025 during a post-pandemic rebound before declining to 1,279,758 in March 2026.
- Washington and Hawaii saw the largest percentage declines. International student counts dropped 15.8% in Washington and 10.5% in Hawaii from 2025 to 2026, with significant declines also found in states like Montana (-9.9%) and Missouri (-7.4%).
International Students in the U.S. by Education Level
More than 90% of all international students are enrolled in postsecondary education
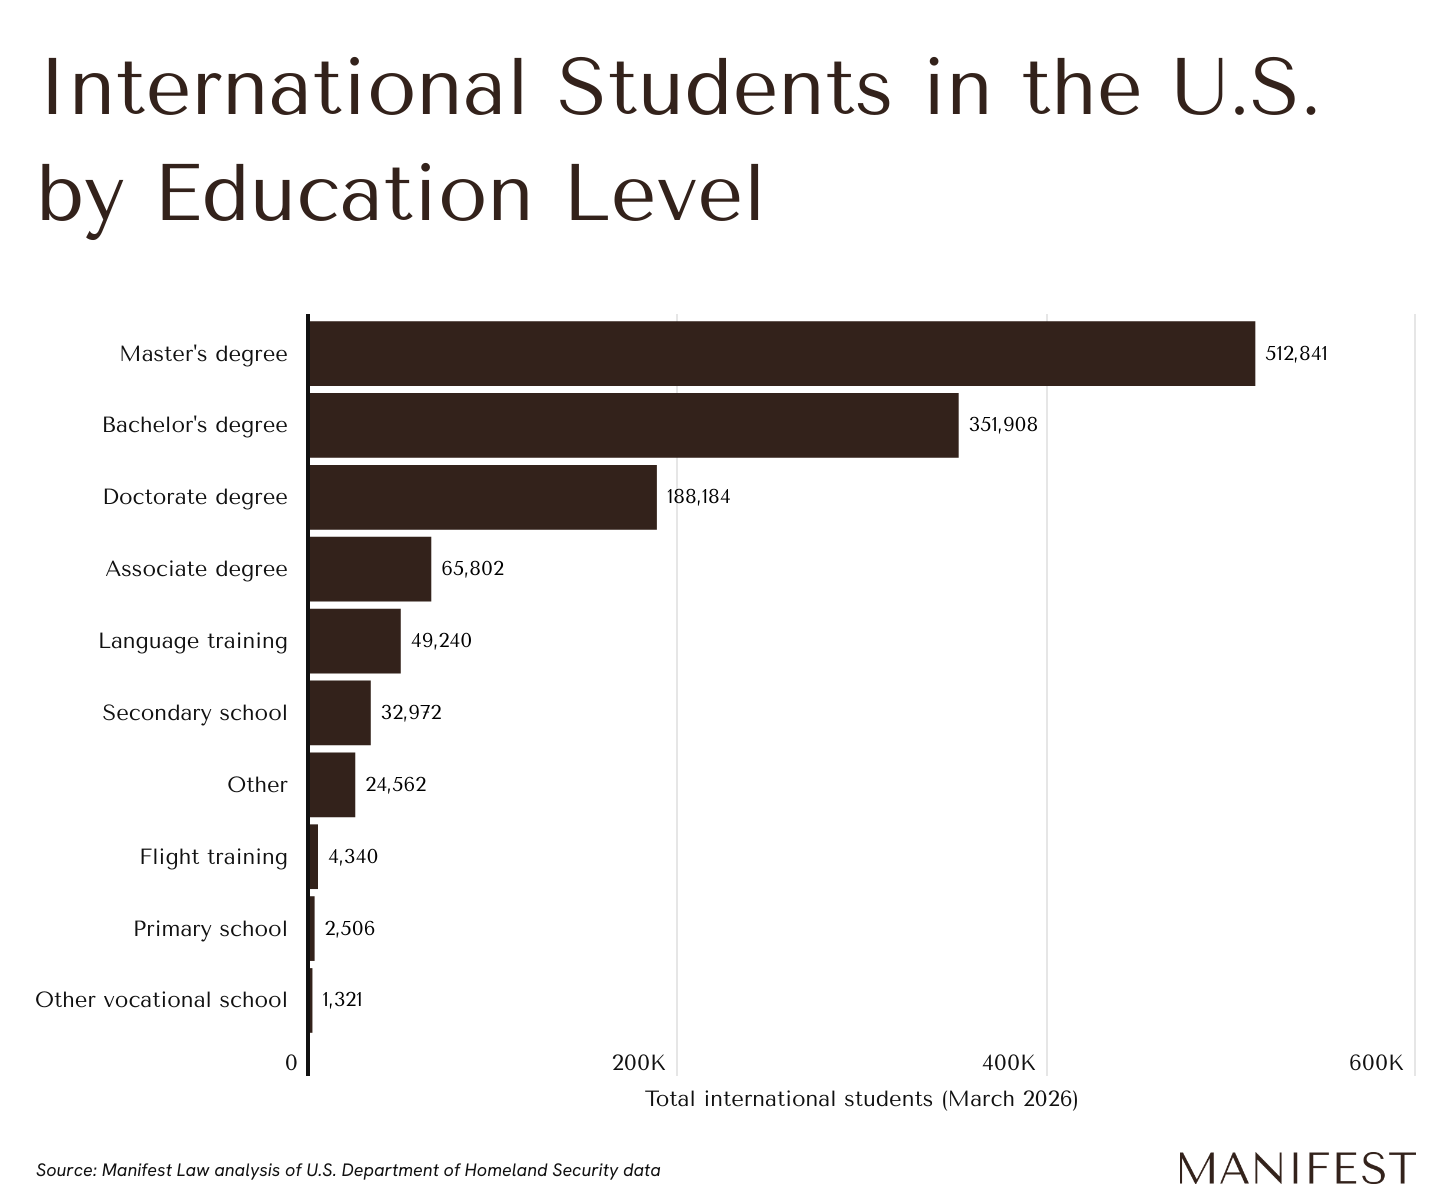
Source: Manifest Law analysis of U.S. Department of Homeland Security data | Image Credit: Manifest Law
International students in the United States—including those participating in the post-graduation Optional Practical Training (OPT) and Practical Training (PT) programs—are overwhelmingly concentrated in postsecondary education. As of March 2026, master’s degree programs enrolled 512,841 international students, followed by 351,908 in bachelor’s programs and 188,184 in doctoral programs. An additional 65,802 students were enrolled in associate degree programs. Combined, these categories account for over 90% of all international students in the U.S.
Enrollment outside of postsecondary education is comparatively limited. Language training programs account for 49,240 students, while secondary schools enroll 32,972. Other categories—including flight training (4,340 students), primary school (2,506), and vocational programs (1,321)—represent only a small share of the total. International enrollment remains concentrated in degree-granting programs rather than earlier-stage or non-degree pathways.
Where Are International Students Coming From?
Nearly half of all international students in the U.S. are citizens of India or China
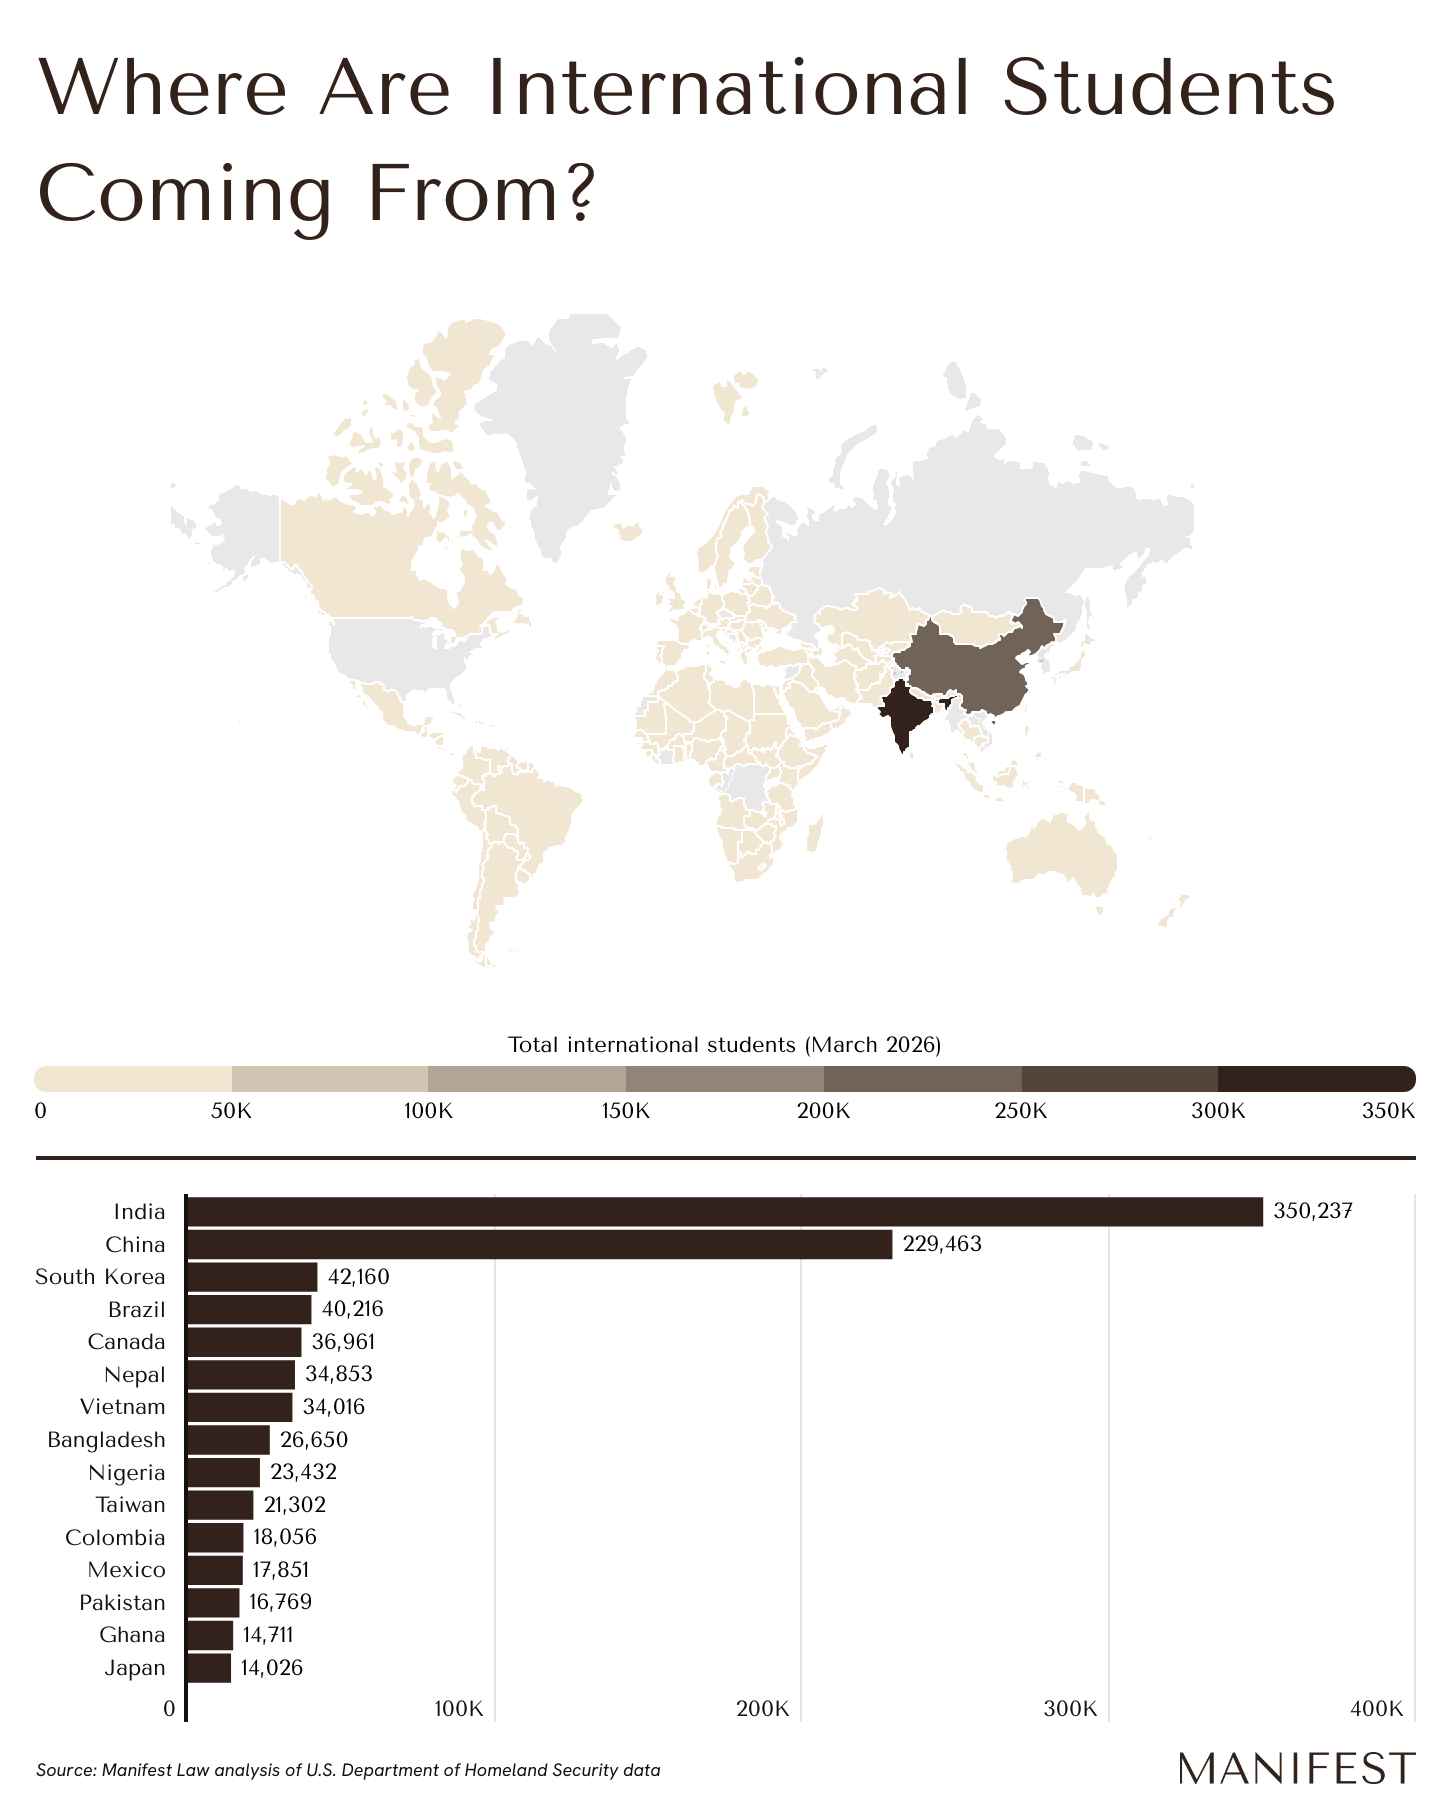
Source: Manifest Law analysis of U.S. Department of Homeland Security data | Image Credit: Manifest Law
While international students in the United States are largely concentrated in postsecondary education, they also come from a relatively concentrated set of countries. India and China account for the largest shares by a wide margin. As of March 2026, 350,237 international students were citizens of India, while 229,463 were from China. Combined, these two countries represent nearly half of all international students in the U.S.
Several structural factors help explain why students from these countries disproportionately enroll in U.S. institutions. In both India and China, access to top-tier universities is highly constrained, with far more qualified applicants than available seats. Students who do not secure admission to these institutions often face a choice between attending lower-tier domestic universities or pursuing education abroad. In this context, U.S. institutions—across a wide range of selectivity levels—offer a combination of academic specialization and access to labor market opportunities and wages that can be difficult to replicate domestically. Many international students, particularly from India, enroll in graduate-level STEM and business programs that are closely tied to employment pathways.
These advantages persist despite growing policy headwinds. Increased visa scrutiny, expanded screening requirements, and rising costs associated with employment-based visas have introduced new friction into the system. Even so, the combination of educational access and potential career outcomes continues to sustain strong demand from key source countries.
Beyond India and China, the distribution becomes significantly more diffuse. South Korea (42,160 students), Brazil (40,216), and Canada (36,961) are the next largest countries of origin, followed by a long tail of countries each contributing smaller numbers of students. This pattern reflects a mix of regional proximity, bilateral education ties, and varying levels of access to U.S. study and work pathways.
Trends in the International Student Population Over Time
International student growth is leveling off after reaching record levels in 2025


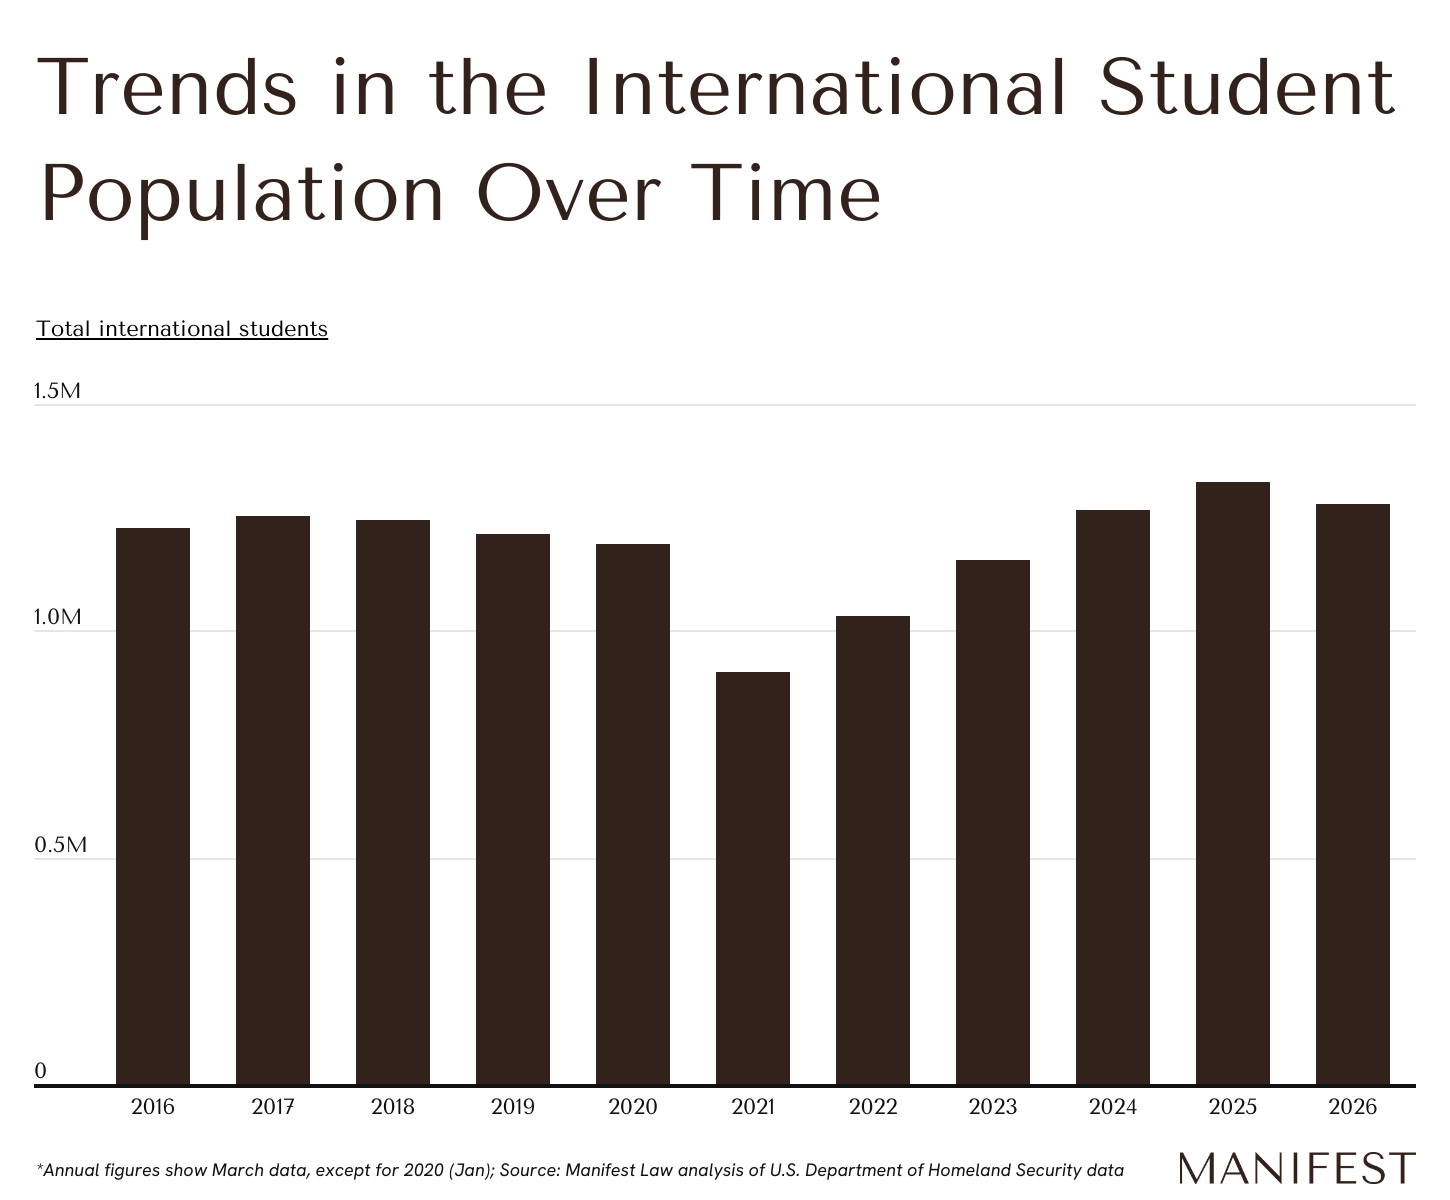
Source: Manifest Law analysis of U.S. Department of Homeland Security data | Image Credit: Manifest Law
International student enrollment in the United States has followed a nonlinear trajectory over the past decade, shaped by both policy changes and global disruptions. After reaching 1,250,881 students in March 2017, total enrollment began to decline, falling to 1,189,423 by January 2020. This pre-pandemic reduction in both F-1 academic and M-1 vocational visas was driven by a confluence of economic, political, and global factors. The decline during this period was largely fueled by the escalating costs of American higher education, higher rates of visa rejections and processing delays, shifts in federal immigration policy under the Trump administration, and growing competition from universities in other countries.
The most dramatic shift occurred in 2021, when enrollment dropped to 910,766 as COVID-19 disrupted global mobility. U.S. consulates suspended routine visa services, travel restrictions limited entry, and evolving guidance around online learning created additional uncertainty for F-1 and M-1 visa students. Although temporary policy adjustments—such as allowing remote study while maintaining visa status—provided some flexibility, the total count of international students in the U.S. declined dramatically.
Enrollment rebounded in the following years, climbing to a record 1,325,800 in 2025 as visa processing resumed and pent-up demand returned. However, that growth appears to be stagnating. As of March 2026, total enrollment declined to 1,279,758, marking the first year-over-year decrease since the recovery began. This slowdown comes amid renewed policy friction, including expanded visa screening requirements, backlogs in consular processing, and rising costs associated with maintaining and transitioning from student status. Together, these factors suggest that while the U.S. remains a leading destination for international students, structural and policy constraints continue to shape the pace of growth.
Which States Have Lost the Most International Students?
Washington and Hawaii saw more than 10% declines year-over-year
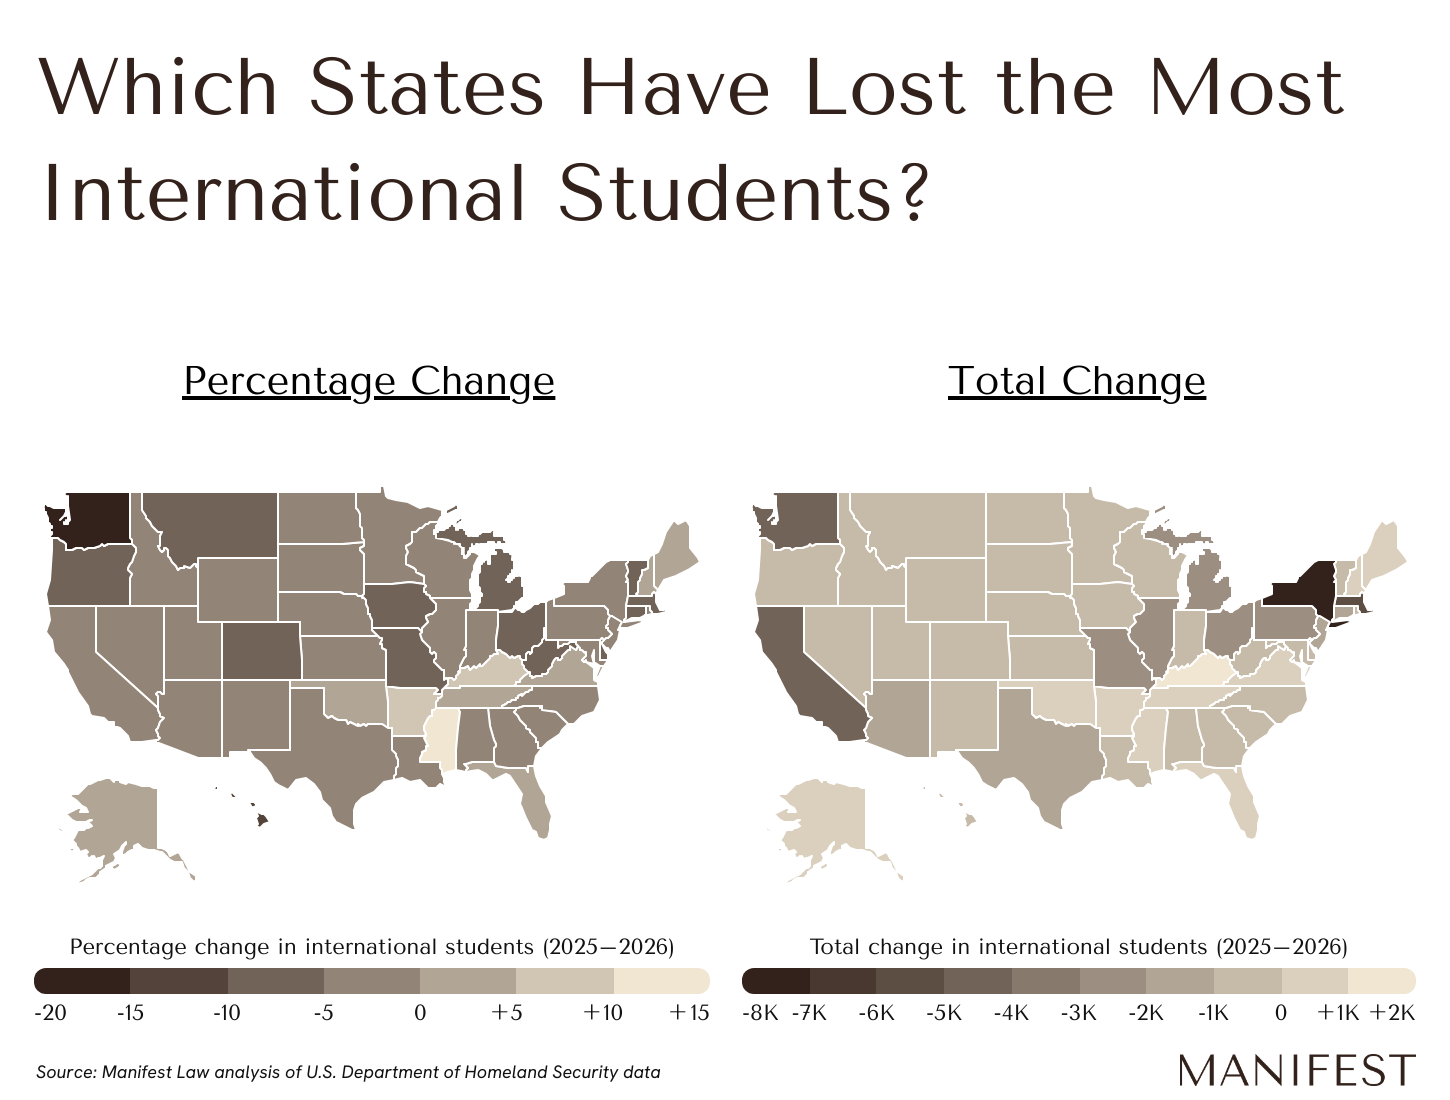
Source: Manifest Law analysis of U.S. Department of Homeland Security data | Image Credit: Manifest Law
Recent declines in international student enrollment have not been evenly distributed across the United States, with several states experiencing sharper contractions than others. The steepest declines are concentrated in parts of the West and smaller-state markets. Washington recorded the largest year-over-year drop, with international student enrollment falling by 15.8% between March 2025 and 2026, followed by Hawaii at -10.5% and Montana at -9.9%. Other states with notable declines include Missouri (-7.4%), Ohio (-7.3%), and Delaware (-6.8%), suggesting that losses are occurring across a mix of geographic regions rather than being isolated to a single part of the country.
Several factors may help explain why certain states are experiencing more pronounced declines. States like Washington and Hawaii have a higher reliance on students from key source countries in Asia, particularly China, making them more sensitive to shifts in visa issuance, geopolitical tensions, and changing student preferences. At the same time, smaller or less diversified higher education markets—such as Vermont with 1,481 international students, or Montana with just 816—may be more vulnerable to enrollment swings, as even modest changes in international inflows can translate into larger percentage declines.
In terms of absolute numbers, coastal states known for their top-tier higher education institutions saw the largest declines. Home to globally recognized institutions like New York University (NYU) and Columbia University, New York State saw the largest losses, with a decline of 7,431 international students from March 2025 to March 2026. Massachusetts, which hosts massive international cohorts at Northeastern University and Boston University, experienced the second-largest decrease, losing 5,021 students. California, anchored by heavyweights like the University of Southern California (USC), followed closely behind with a loss of 4,741 students. Finally, Washington rounded out the hardest-hit states, shedding 4,330 active records over the same one-year period despite the traditional draw of the University of Washington.
Losing out on international students could create challenges for these universities. Because international students typically do not receive scholarships, they pay out of pocket for their tuition. This revenue goes toward funding programs and research that benefit the university’s students as a whole.
Here is a summary of the data for New Hampshire:
- Percentage change in international students (2025–2026): +1.2%
- Total change in international students (2025–2026): +101
- Total international students (March 2026): 8,573
- Total international students (March 2025): 8,472
- Share of all international students in the U.S.: 0.7%
- Most common country of citizenship for international students: India
For reference, here are the statistics for the entire United States:
- Percentage change in international students (2025–2026): -3.6%
- Total change in international students (2025–2026): -46,407
- Total international students (March 2026): 1,233,676
- Total international students (March 2025): 1,280,083
- Share of all international students in the U.S.: N/A
- Most common country of citizenship for international students: India
What’s Next for F-1 and M-1 Visas?
Looking ahead, the trajectory of F-1 and M-1 visa issuance will likely be defined by the tension between global educational demand and tightening domestic immigration policy. As the U.S. labor market evolves and the pathway from a student visa (F-1) to a dual-intent work visa (H-1B) remains highly competitive and heavily backlogged, prospective students will increasingly scrutinize the long-term return on investment of a U.S. degree. Immigration agencies are expected to maintain rigorous vetting and interview processes, and any future regulatory changes to post-graduation work authorizations—most notably Optional Practical Training (OPT)—will heavily influence international enrollment. If the transition from a student visa into the U.S. workforce becomes more restrictive or expensive, the recent plateau in international student numbers could solidify into a longer-term contraction.
In response to these headwinds, U.S. educational institutions will be forced to adapt their global recruitment strategies. With Chinese enrollments continuing to soften amid geopolitical friction and Indian enrollments heavily concentrated in specific graduate-level STEM and business programs, universities are expected to aggressively diversify their international pipelines to avoid over-reliance on just two nations. Over the next few years, emerging markets in Sub-Saharan Africa, Latin America, and Southeast Asia will likely become critical battlegrounds for global talent. Ultimately, while the United States remains a premier destination for international education, sustaining its historic dominance will require navigating an increasingly competitive global market and a complex, shifting domestic immigration landscape.
For more information, a detailed methodology, and complete results, see The U.S. States Losing the Most International Students on Manifest Law.


(0) comments
Welcome to the discussion.
Log In
Keep it Clean. Please avoid obscene, vulgar, lewd, racist or sexually-oriented language.
PLEASE TURN OFF YOUR CAPS LOCK.
Don't Threaten. Threats of harming another person will not be tolerated.
Be Truthful. Don't knowingly lie about anyone or anything.
Be Nice. No racism, sexism or any sort of -ism that is degrading to another person.
Be Proactive. Use the 'Report' link on each comment to let us know of abusive posts.
Share with Us. We'd love to hear eyewitness accounts, the history behind an article.