


Roadways are a vital component of infrastructure in the United States. The vast majority of goods are transported by truck, highlighting the economy’s need for reliable roadways to connect supply chains and move goods and services efficiently across borders. Most commuters use roads daily to get to work, and individuals also rely on roadways for crucial access to resources including employment, social, health, and education services.
However, many highways, major roads, and bridges remain in need of urgent repair. Hazardous road conditions continue to negatively impact the economy, contribute to traffic congestion, and threaten driver safety. While the 2021 Infrastructure Investment and Jobs Act (IIJA) dedicated a historic $110 billion to roads and bridges—spurring over 62,000 transportation projects nationwide by 2026—the work is far from over. Recent congressional reports underscore the necessity of extending these funding measures, as their scheduled expiration in October 2026 threatens essential investments in road safety enhancements, economic growth initiatives, and projects designed to lower shipping costs, highlighting that reversing decades of deferred maintenance requires a sustained, long-term commitment.
Researchers at Construction Coverage—a publication covering construction trends, infrastructure, and industry research—analyzed data from the U.S. Department of Transportation (DOT) to evaluate the condition of roadways across the country.
Here are the key takeaways from the analysis:
- Highway and street construction spending has surged. In large part due to the Infrastructure Investment and Jobs Act, road construction spending rose to roughly $150 billion annually, an increase of approximately 25%.
- A staggering 13.1% of major U.S. roadways are in poor condition. Even with increased investment, more than one in every eight miles of major roadways are in disrepair.
- Rhode Island leads the nation, with 36.2% of its major roadways rated in poor condition. Despite making incremental improvements in recent years, the state’s share of poor roads remains nearly seven percentage points higher than any other state.
Highway & Street Construction Spending Over Time
Investment in America’s roadways skyrocketed in recent years
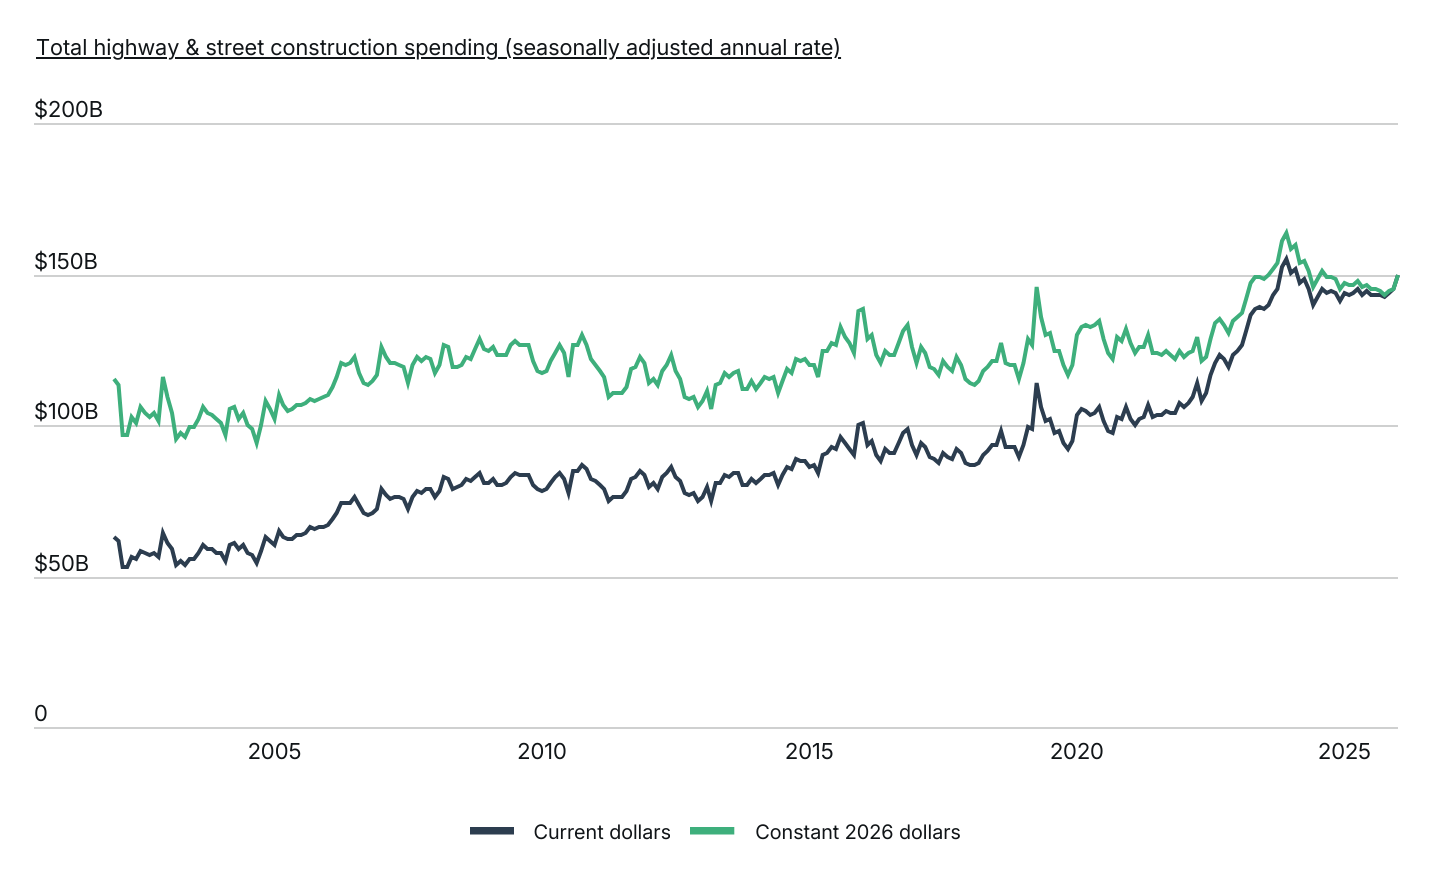
Source: Construction Coverage analysis of U.S. Census Bureau data | Image Credit: Construction Coverage
The passage of the Infrastructure Investment and Jobs Act came at a critical time. After adjusting for inflation, highway and street construction spending had largely stagnated for much of the previous decade. From 2010 to 2021, real spending hovered around $120 billion annually with little sustained growth—despite persistent infrastructure needs across the country.
The new federal investment helped reverse that trend. In constant 2026 dollars, annual spending surged from about $120 billion in mid-2022 to averaging nearly $150 billion through 2025 and into early 2026, providing renewed capacity to address long-standing maintenance backlogs and advance long-term transportation projects.
Trends in America’s Road Conditions
The share of major roads in good condition has increased steadily since 2000
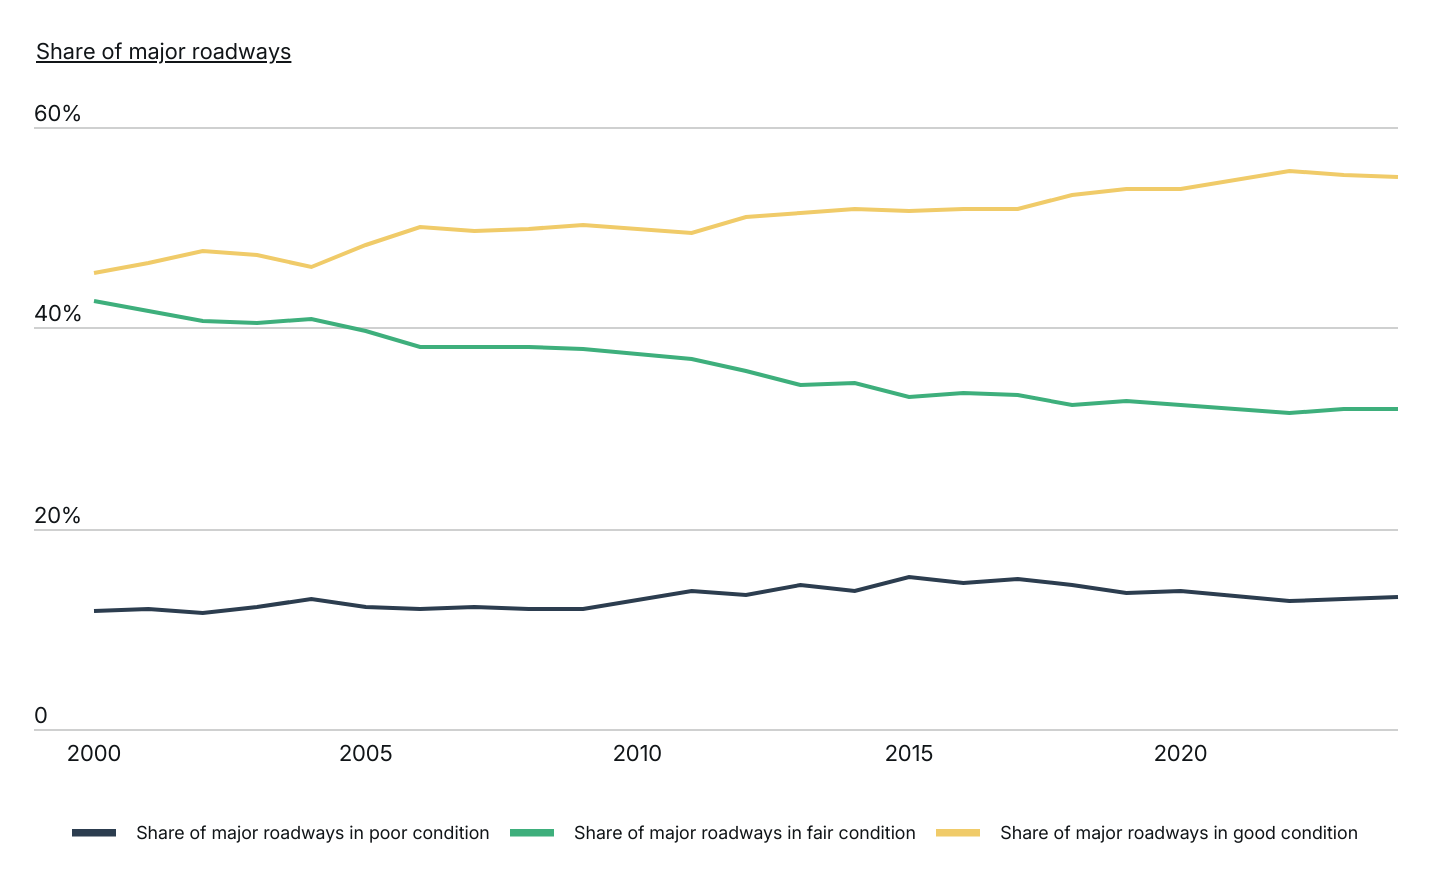
Source: Construction Coverage analysis of Federal Highway Administration data | Image Credit: Construction Coverage


Despite increased investment, many U.S. roads remain in poor shape. As defined by the DOT using International Roughness Index (IRI)—a standardized mathematical metric used to quantify the smoothness and ride quality of road pavement—the share of major roadways in poor condition rose slightly from 2000 to 2024, from 11.8% to 13.1%. At the same time, there has been clear progress: the share of roads in good condition increased by nearly 10 percentage points, reaching 55.1% in 2024, with noticeable improvements in the years following the 2021 infrastructure law.
The most significant shift occurred in the middle category. Roads classified as being in fair condition declined from 42.6% in 2000 to 31.9% in 2024. This suggests that many roads have either improved or worsened enough to move into a different category—reflecting a gradual but measurable change in overall road quality.
The Percentage of Roads in Poor Condition by State
The Northeast and California have the most roads in poor condition
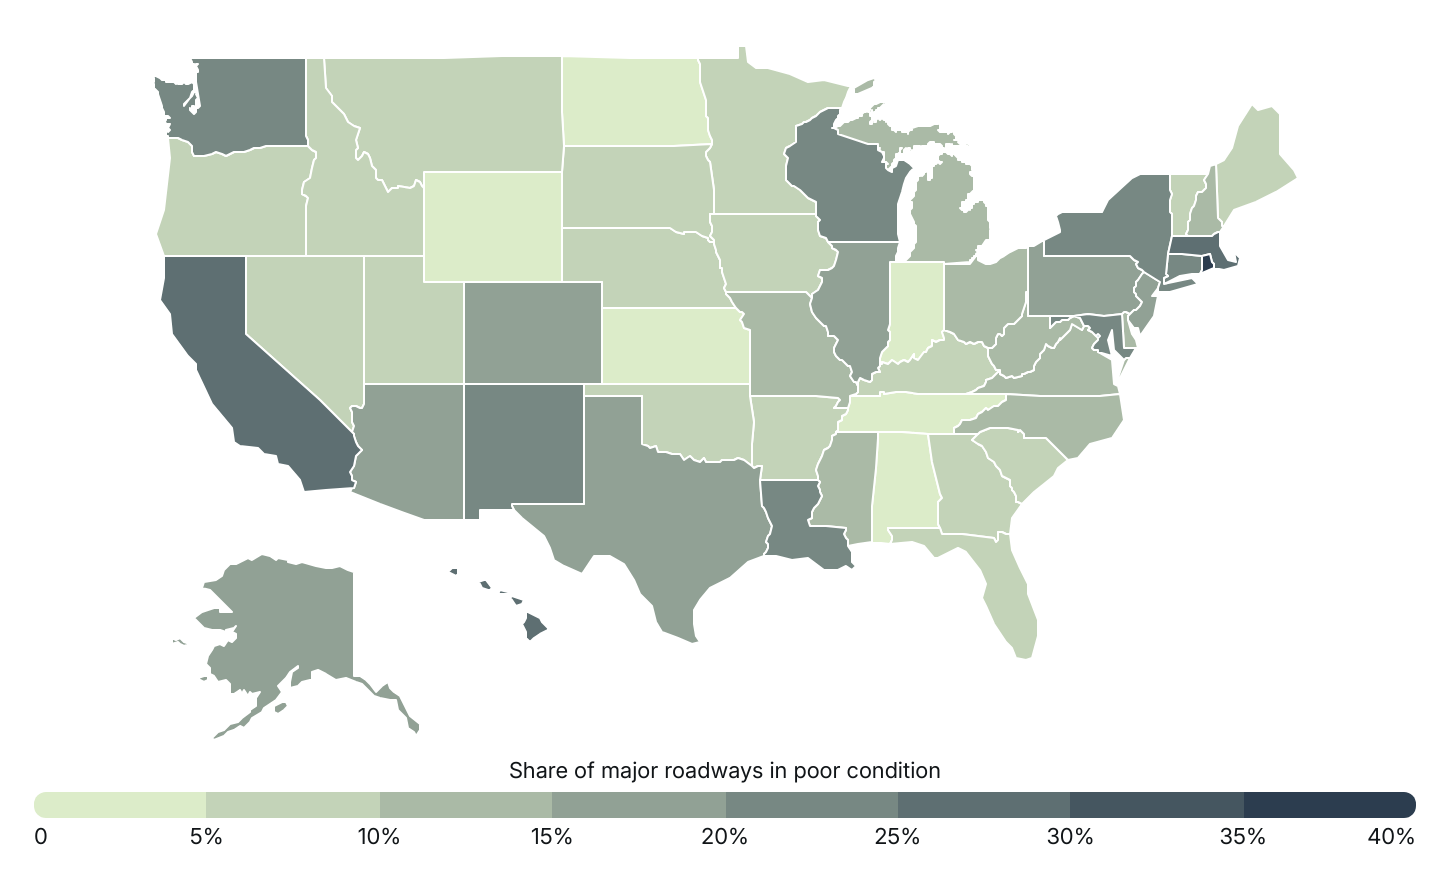
Source: Construction Coverage analysis of Federal Highway Administration data | Image Credit: Construction Coverage
While public investment in roads is growing, many states continue to face significant maintenance challenges—particularly in the Northeast and along the West Coast. Rhode Island leads the nation, with 36.2% of its major roadways rated in poor condition—a slight improvement from years past. Other Northeastern states, including Massachusetts (29.3%), New York (24.3%), Maryland (21.6%), and Connecticut (20.5%), also rank among the worst. These states feature dense urban centers, with some of the country’s oldest housing and infrastructure, yet still rely on heavily trafficked roadways.
Outside the Northeast, California reports 28.4% of its roads in poor condition, reflecting wear from its large, car-dependent population. Hawaii follows closely at 26.5%, despite its small population and geographic footprint.
In contrast, many Midwestern and Southern states report far lower shares of deteriorating roads. Indiana (4.1%), Wyoming (3.0%), and Kansas (2.8%) are among the best-performing states, highlighting a stark regional divide in infrastructure quality. Lower traffic volumes and a higher share of rural roads make maintaining highway infrastructure easier in many of these states.
Here is a summary of the data for New Hampshire:
- Share of major roadways in poor condition: 10.8%
- Share of major roadways in fair condition: 23.4%
- Share of major roadways in good condition: 65.9%
- Daily vehicle-miles traveled per capita: 26.9
"For reference, here are the statistics for the entire United States:
- Share of major roadways in poor condition: 13.1%
- Share of major roadways in fair condition: 31.9%
- Share of major roadways in good condition: 55.1%
- Daily vehicle-miles traveled per capita: 26.5
For more information, a detailed methodology, and complete results, see U.S. States With the Worst Roads on Construction Coverage.


(0) comments
Welcome to the discussion.
Log In
Keep it Clean. Please avoid obscene, vulgar, lewd, racist or sexually-oriented language.
PLEASE TURN OFF YOUR CAPS LOCK.
Don't Threaten. Threats of harming another person will not be tolerated.
Be Truthful. Don't knowingly lie about anyone or anything.
Be Nice. No racism, sexism or any sort of -ism that is degrading to another person.
Be Proactive. Use the 'Report' link on each comment to let us know of abusive posts.
Share with Us. We'd love to hear eyewitness accounts, the history behind an article.