


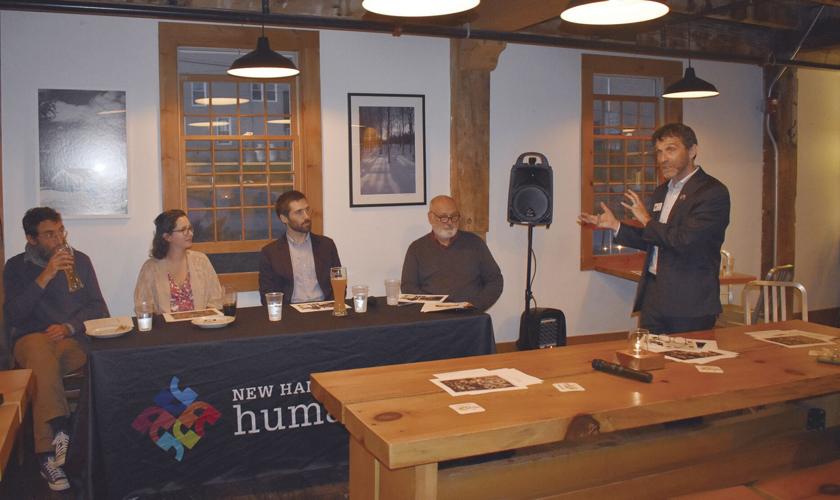
LITTLETON — The art that accompanies stories can be just as important as the words used, according to four “primary sources” of news images during a panel discussion at the Schilling Beer Company on Oct. 25, sponsored by New Hampshire Humanities.
A photograph, illustration or graphic chart can catch someone’s attention much more easily than a block of words, making those images a crucial participant in the dissemination of news.
Part of New Hampshire Humanities’ “Ideas on Tap” program, exploring the role of journalism in a democracy, the discussion focused on the importance of selecting images that bring the reader into the story while remaining true to the facts and avoiding misrepresenting what happened.
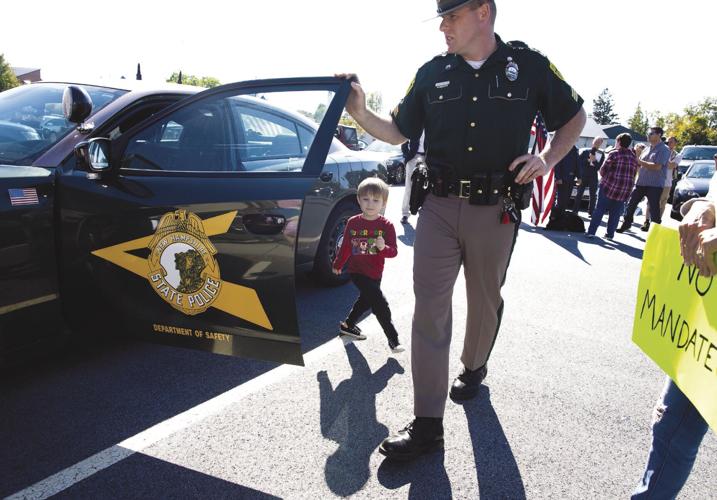
Geoff Forester, photo editor at The Concord Monitor, used a protest during a meeting of the governor and Executive Council to illustrate how he approaches the news. His image of a state trooper giving a young boy a look at his police cruiser was not part of the main story — protesters getting arrested for outbursts that interrupted the Executive Council session — but it lent another layer to the news of the day.
Forester explained that the boy's parents had just been arrested for disrupting the meeting, leaving the boy temporarily alone. The trooper decided that giving the traumatized youngster a tour of his cruiser would help comfort the boy, taking his mind off the confusion around him. The photo ran secondary to the images of people chanting and holding up signs, but Forester said it helped broaden the story.
It also brought a backlash from the parents who objected to the use of their son’s name and photograph in the newspaper. The Monitor editorial team agreed to revise the online caption to remove the boy’s name, but kept the photo with the story.
“I thought it was meaningful because here they were screaming about police tyranny in government, and here’s this state policeman escorting a 4-year-old and making sure he’s safe,” Forester said. “So it was juxtaposed to the actual event.”
Johnny Bassett, data and research editor for the Granite State News Collaborative, explained how charts can make complex issues more accessible to readers. He presented a series of charts showing how Manchester’s zoning ordinances had led to high- and low-density residential areas over the years. The charts of Manchester in its entirety, the center city, and the north end during 1927, 1965, 2001 and 2021 illustrated how the residential patterns changed over time.
“It helped us to start to explain why there are only high-density units in the middle of the city,” Bassett said. “That was enough of a clear pattern that then we could look back over the history and figure out what had created this zoning, why they had picked those parts of the city to zone that way in 1927. That wasn’t an arbitrary decision that they made, and out of that, we came up with a broader historical narrative that we ended up publishing.”
Behind those images, he said, “are hundreds of maps and hundreds of pages of zoning ordinances that the reader is never going to see.”
Erin Petenko is the data and graphics reporter at VTDigger and she, also, employs charts to translate complex data into an image that helps readers understand what it all means. She illustrated her talk with charts showing Vermont’s population losses and gains over a decade.
Petenko used U.S. Census Bureau data to track the migration of domestic and international populations in and out of the state. There was a net gain in international residents and a general out-migration of domestic residents through much of the decade from 2010 to 2020. The chart showed a huge leap in domestic residents during the pandemic, while the international population, which remained unchanged in 2020, increased only slightly in 2021.
She was able to use tax records for a migration chart showing trends across the United States because people filing with the Internal Revenue Service include their addresses. It means that information is only available from those who file tax returns, which Petenko notes on the chart.
“One of the things that I ended up talking about is the affordability of the state and whether people were fleeing because they couldn’t afford to live there,” she said.
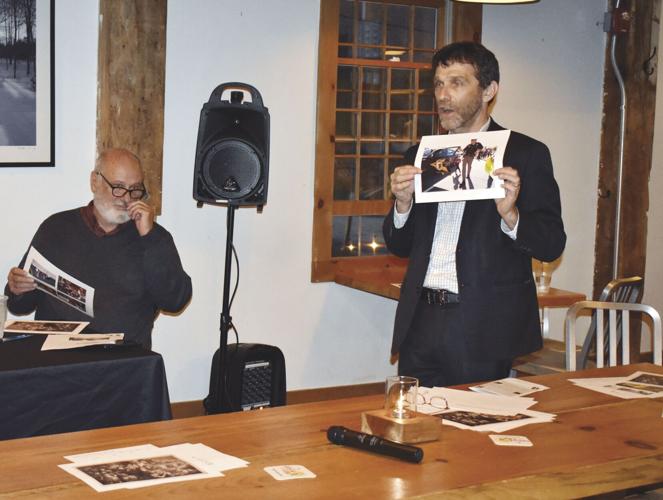
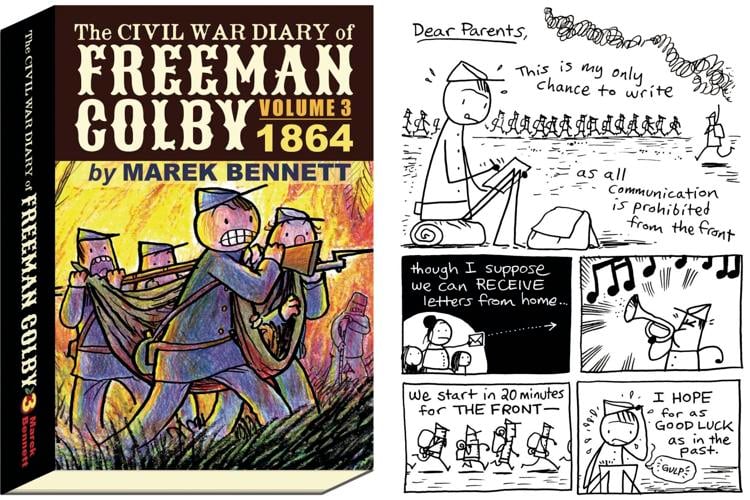
Marek Bennett, whose website is MarekBennett.com, is a cartoonist with an interest in history. He spoke about his graphic novel series on “The Civil War Diary of Freeman Colby.”
He explained that his interest in the Civil War began by viewing the Ken Burns documentary and wanting to know more.
“I can go read Gen. Grant’s memoirs ... and they’ll give you lots of answers, but they’ll give you the 10,000-foot view because the general of a 150,000-person army has a certain perspective on what’s happening in this state or this region,” Bennett said. “I wanted to stick to a personal view of somebody you’ve never heard of.”
Freeman Colby was “just a town kid” in Henniker who was a substitute teacher before the Civil War. He joined the Union Army in 1862. Bennett decided to illustrate his diary in the form of a graphic novel.
“I started off thinking I had to believe my primary source because he wrote it in his diary. 'That must be true.' If you’ve ever kept a diary, you know that’s not true. I knew that it wasn’t true on some level, but it took me the first volume to realize I don’t think I’m getting the full story here,” Bennett said. That led to two more volumes (so far) in which he has delved into “the stories that aren’t being told.”
“I always say I have a lot of collaborators, that none of them are still living,” he said, explaining that he finds it fun to look for other 19th-century sources of information.
New Hampshire Humanities’ executive director, Michael Haley Goldman, who acted as moderator for the discussion, asked questions of the panelists and urged those in the audience to also ask questions, drawing out their views on why the images were important and how they remained true to the facts.
“There’s no question that words are important; words are very important,” Forrester said. “But the way I approach it is that I want to get people to get in the situation. They can’t be there or don’t want to be there, but it is still important and they want to somehow visualize it. I want to be that visual reporter.”


(0) comments
Welcome to the discussion.
Log In
Keep it Clean. Please avoid obscene, vulgar, lewd, racist or sexually-oriented language.
PLEASE TURN OFF YOUR CAPS LOCK.
Don't Threaten. Threats of harming another person will not be tolerated.
Be Truthful. Don't knowingly lie about anyone or anything.
Be Nice. No racism, sexism or any sort of -ism that is degrading to another person.
Be Proactive. Use the 'Report' link on each comment to let us know of abusive posts.
Share with Us. We'd love to hear eyewitness accounts, the history behind an article.