



(AURORA, COLORADO) Mr. V felt tightness across his chest. His deepest breaths felt shallow. He sought help at an emergency department, where a resident physician found several worrying signs, including swelling of his hands and legs as well as heart enlargement on a chest X-ray.
Everything seemed to point to one diagnosis: heart failure, where the heart’s inability to pump blood efficiently causes fluid to build up in the body. But one result did not fit.
To diagnose heart failure, doctors often check blood levels of a hormone called BNP, which the heart releases under strain. Mr. V’s BNP levels came back normal. The resident remembered learning that BNP can be falsely normal in patients with obesity or who are overweight, even when they have heart failure. With that in mind, he dismissed the normal BNP result and ordered a diuretic to help Mr. V shed excess fluid – standard treatment for heart failure.
But Mr. V did not feel any better. The next day, a colleague of mine who was supervising the medical team examined him with an ultrasound and made a diagnosis that had been overlooked: cardiac tamponade, a life-threatening condition in which a build-up of fluid in the sac surrounding the heart compresses it so tightly that it can barely pump.
A squeezed heart needs more blood running through it, not less, so the diuretic could have been fatal. Luckily, his heart held on long enough for doctors to rush him to an operating room and drain the fluid, saving his life. Could this close call have been avoided?
The resident was right: Many patients with heart failure and excess body fat do have normal BNP levels. However, “normal” is not as simple as it sounds.
Doctors generally consider BNP values under 100 picograms per milliliter, or pg/mL, to be normal. Patients with excess weight and heart failure often have a BNP below 100, but usually not by much. A BNP value under 50 is uncommon in heart failure, even in very overweight patients. Mr. V’s BNP was 14.
This result was not just normal. It was so low that it argued strongly against a diagnosis of heart failure. But the label “normal” treated a BNP of 14 the same as a BNP of 95, hiding the very information that could have prompted doctors to look for another explanation for Mr. V’s symptoms.
Mr. V’s case reveals a deeper flaw in how doctors are trained to interpret lab results. Buried inside the word “normal” is key information that tells doctors how strongly a test result argues against a diagnosis. Some normal results can make a diagnosis slightly less likely, while others may effectively rule it out.
As a physician who studies and teaches how best to interpret diagnostic tests, I often wonder: If a test result carries so much nuanced information, why do some doctors settle for a simple “normal” or “abnormal” reading instead?
When ‘normal’ isn’t normal
The 21st Century Cures Act, signed into law by President Barack Obama in 2016, gave patients greater access to their own healthcare information. Through online portals, people can often view their test results before a clinician has the chance to review them.
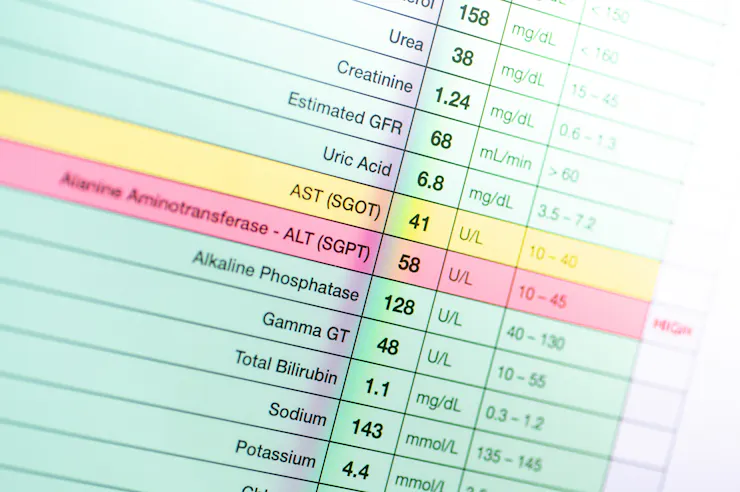
Those results usually come paired with a simple cutoff separating “normal” from “abnormal.” Although there are benefits to transparency, there is also a hidden cost: false alarm from “abnormal” results, and false reassurance from “normal” ones.

When I teach clinicians how to interpret diagnostic results, many are surprised to learn that, for numerous tests, mildly abnormal results may lower the likelihood of the disease they’re used to diagnose.
Take D-dimer, a blood test that doctors often order to determine whether patients with chest pain or difficulty breathing have a blood clot. A D-dimer above 500 nanograms per milliliter, or ng/mL, is labeled abnormal. But values between 500 and 1,000 actually slightly decrease the odds of a blood clot. For those at low risk for blood clots, a result in that range is nearly as reassuring as a “normal” one, even though it’s flagged as abnormal on the report. The reverse can also be true.
Cholesterol is another example. Laboratories consider levels of LDL, or “bad” cholesterol, under 100 milligrams per deciliter, or mg/dL, to be normal. However, for patients who have already suffered a heart attack or stroke, anything above 55 is too high.
Sorting results into normal and abnormal categories has a certain appeal. It makes interpreting tests easy and fast. It also reduces uncertainty. However, human biology is far from simple, and a lot of nuances are lost in that simplification.
The exact value of a test result tells doctors far more than the mere labels “normal” or “abnormal” can. Imagine a blood pressure machine that simply gave a reading of “elevated” or a heart rate monitor that read “low” instead of specific numbers. Doctors would never use such imprecise tools. Yet they often do when it comes to diagnostic tests.
Patients should feel empowered to ask their clinicians what a specific number means for them. A “normal” or “abnormal” label is a starting point for a conversation, not the final word.


Ratios, not binaries
My colleagues and I conducted a study that asked a simple question: What if, alongside each lab value, doctors saw not just a cutoff value for normal, but also how strongly each value points toward – or away from – a diagnosis?
We call this metric an interval likelihood ratio. It tells doctors how much a test result should raise or lower the odds that a patient has a specific diagnosis.
To derive these ratios, researchers run a test in many patients with and without the diagnosis the test is designed to pick up. Rather than drawing a single line between “normal” and “abnormal,” researchers divide the results into ranges. Each range compares how often patients with or without the diagnosis had a result within those values.
To test whether interval likelihood ratios help improve medical decisions, we recruited more than 600 clinicians across four major U.S. academic institutions. Each participant was asked to read two scenarios like Mr. V’s and make a key decision on how to manage a patient’s case based on a lab result. Everyone saw the exact test value. We randomly assigned some participants to see the numerical lab value alongside the standard cutoff for a normal result, and others to see it alongside interval likelihood ratios.
The difference between how these groups performed was not trivial.
Clinicians assigned to see interval likelihood ratios made a correct call 93 out of 100 times, while those seeing a single cutoff got it right 82 times out of 100. In other words, for roughly 1 in 10 patients like Mr. V, doctors could make a better decision if shown the degree to which a test result changes the odds of a particular diagnosis compared to merely seeing a cutoff for the normal range.
Improving how test results are displayed could help patients make better sense of their own results, help clinicians avoid critical mistakes and help health systems deliver safer care.
Reducing fatal errors
Clinicians learn to understand the degree to which a particular test result is abnormal through experience, shaping their intuition as they review new test results. However, intuition can be wrong.
Diagnostic errors remain one of the leading causes of harm in medicine. Our study found that interval likelihood ratios helped attending physicians, residents and advanced practice providers make better decisions, regardless of how long they’ve been practicing or their training background.
There is a legal dimension to how test results are labeled. A result flagged “abnormal” can feel like it obligates a clinician to act, such as ordering another scan, even when their own judgment says otherwise. Interval likelihood ratios can change that calculus, providing clinicians a documented, evidence-based reason to hold off ordering advanced tests and potentially saving their patients from the health risks they may entail.
The challenge is how and where to find high-quality research studies to derive interval likelihood ratios when electronic health records display only binary cutoffs as aids to interpreting test result values. It is also important to note that our study showed clinicians made better decisions in simulated scenarios, which is not the same as making decisions with real patients. The next step is testing whether these gains hold up in everyday practice, across different institutions, care settings and lab tests.
Test results are more than normal or abnormal. For patients like Mr. V, the difference between these labels and the numbers behind them can be the difference between life and death.
This article is republished from The Conversation, a nonprofit, independent news organization bringing you facts and trustworthy analysis to help you make sense of our complex world. It was written by: Amiran Baduashvili, University of Colorado Anschutz
Read more:
- How do blood tests work? Medical laboratory scientists explain the pathway from blood draw to diagnosis and treatment
- Medical guidelines that embrace the humility of uncertainty could help doctors choose treatments with more research evidence behind them
- Cholesterol control gets personalized – a cardiologist explains how new guidelines tailor treatment to your unique risk profile
Amiran Baduashvili is the founder of EBM Clarity, Inc, which owns an online course in diagnostic reasoning. His earns no income from this endeavor.


(0) comments
Welcome to the discussion.
Log In
Keep it Clean. Please avoid obscene, vulgar, lewd, racist or sexually-oriented language.
PLEASE TURN OFF YOUR CAPS LOCK.
Don't Threaten. Threats of harming another person will not be tolerated.
Be Truthful. Don't knowingly lie about anyone or anything.
Be Nice. No racism, sexism or any sort of -ism that is degrading to another person.
Be Proactive. Use the 'Report' link on each comment to let us know of abusive posts.
Share with Us. We'd love to hear eyewitness accounts, the history behind an article.