


While the inflation rate has stabilized, it persists above the Federal Open Market Committee’s 2% target, with the cost of shelter continuing to pressure consumer wallets. Data released by the Bureau of Labor Statistics in October 2025 showed the overall Consumer Price Index up 3.0% year-over-year; however, the index for shelter rose 3.6% during that same period. Sustained rent prices remain a driving force behind these higher housing costs.
The dynamics of the rental market in recent years largely reflect simple supply and demand. In the years following the housing crash and Great Recession, the number of new housing construction projects plummeted and was slow to recover over the course of the 2010s. Around the same time, the Millennial generation—America’s largest, with more than 72 million members—began to reach adulthood, introducing greater demand in the market.
Economic conditions during the COVID-19 pandemic exacerbated issues within the rental market. As fast-rising real estate values priced more people out of homebuying, rental markets became more competitive among consumers. On the supply side, inflation in the cost of materials, high interest rates, and tightness in the labor market have all contributed to difficulties in developing new housing stock.
Rental Housing Supply and Prices Over Time
After a historically tight rental market during COVID, rental price inflation has slowed and vacancy rates are on the rise
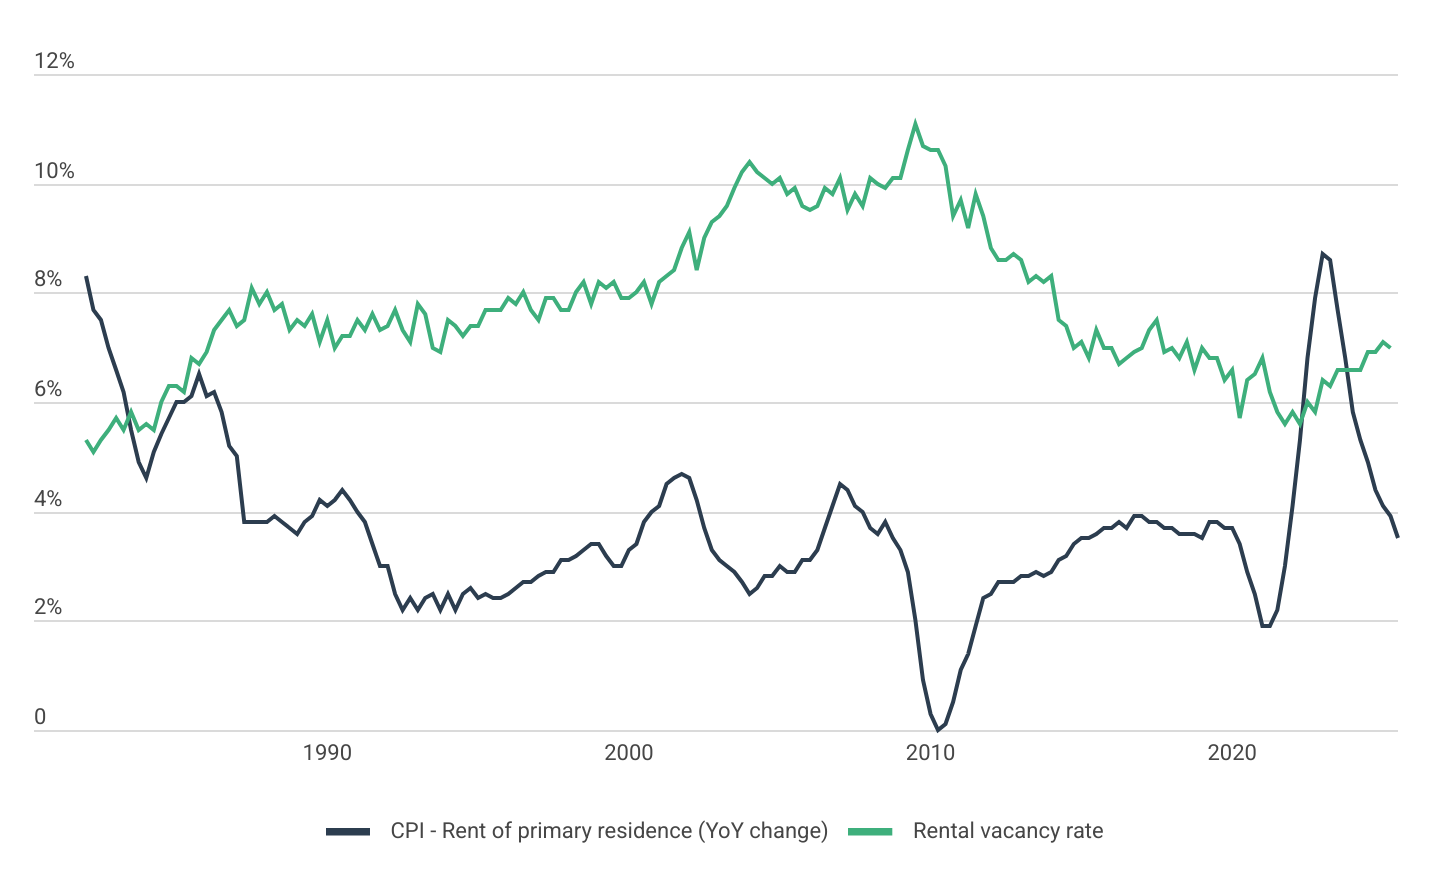
Source: Construction Coverage analysis of U.S. Bureau of Labor Statistics and U.S. Census Bureau data | Image Credit: Construction Coverage
These market dynamics have shifted noticeably over the last year. As supply catches up with demand, the national rental vacancy rate has climbed from its recent lows to 7%—a return to levels more consistent with pre-pandemic norms. With more units available, the pace of price increases has cooled significantly. The year-over-year increase in rents has decelerated from a peak of 8.7% in Q1 2023 to just 3.5% in Q3 2025. While this slowdown marks a return to a more stable environment, renters continue to face steep housing costs due to the compounding effect of previous rent hikes.
Residential Rent Prices by Location
Rents in top coastal states are roughly double those found in the lower-cost parts of the Midwest, South, and Great Plains
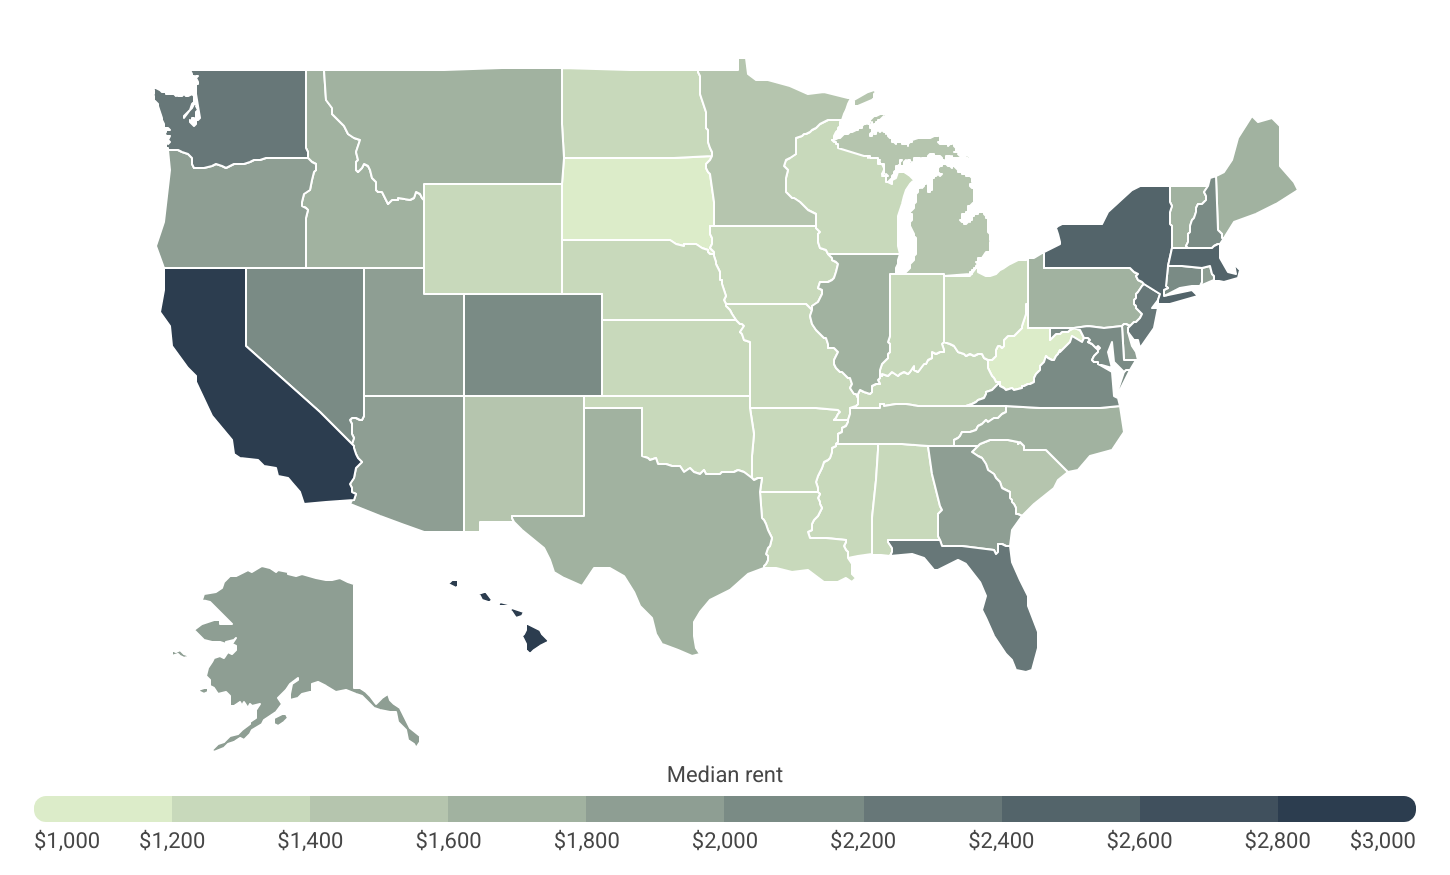


Source: Construction Coverage analysis of U.S. HUD and U.S. Census Bureau data | Image Credit: Construction Coverage
However, the impact of rent increases has not been felt evenly across the U.S., as renters in some locations face much higher costs than in others. Recently released data from the Department of Housing and Urban Development (HUD) shows that 13 states now have median market rents exceeding $2,000 per month, an increase from 12 states last year. California leads the list with a median rent of $2,895, followed by Hawaii at $2,869, Massachusetts at $2,595, and New York at $2,592.
Beyond the broader national supply and demand trends, many of these high-cost areas experience even greater pressures due to strong local economies, high levels of tourism, and more severe supply constraints. These constraints stem from a combination of strict regulations, zoning laws, and geographic limitations that make it particularly difficult to increase housing availability in these regions.
Unsurprisingly, the states with the highest rents are also home to some of the nation’s priciest metropolitan areas for renters. California dominates the list, claiming 9 of the 10 most expensive metros overall, including four of the five most expensive large metros with populations of one million or more.
The analysis was conducted by researchers at Construction Coverage—a resource helping construction professionals track housing trends and build smarter businesses—using data from the U.S. Department of Housing and Urban Development and the U.S. Census Bureau.
Here is a summary of the data for New Hampshire:
- Median rent: $2,143
- Median studio rent: $1,559
- Median 1-br rent: $1,695
- Median 2-br rent: $2,202
- Median 3-br rent: $2,809
- Median 4-br rent: $3,033
For reference, here are the statistics for the entire United States:
- Median rent: $1,924
- Median studio rent: $1,439
- Median 1-br rent: $1,553
- Median 2-br rent: $1,855
- Median 3-br rent: $2,393
- Median 4-br rent: $2,752
For more information, a detailed methodology, and complete results, see U.S. Cities With the Highest Rent Prices on Construction Coverage.


(0) comments
Welcome to the discussion.
Log In
Keep it Clean. Please avoid obscene, vulgar, lewd, racist or sexually-oriented language.
PLEASE TURN OFF YOUR CAPS LOCK.
Don't Threaten. Threats of harming another person will not be tolerated.
Be Truthful. Don't knowingly lie about anyone or anything.
Be Nice. No racism, sexism or any sort of -ism that is degrading to another person.
Be Proactive. Use the 'Report' link on each comment to let us know of abusive posts.
Share with Us. We'd love to hear eyewitness accounts, the history behind an article.