


Millions of U.S. workers handle, store, or work near hazardous chemicals every day—from cleaning solvents and industrial adhesives to flammable gases and corrosive substances. Without proper training, clear labeling, and accessible safety data sheets, employees may not fully understand the health risks they face, including respiratory illness, chemical burns, or fire and explosion hazards. Federal regulators and occupational health experts widely view hazard communication as a foundational component of workplace safety because it determines whether workers have the information needed to protect themselves.
To address these risks, the Occupational Safety and Health Administration (OSHA) established the Hazard Communication Standard (HazCom) in 1983. Often referred to as the “right-to-know” rule, the standard requires employers to classify chemical hazards, label containers, maintain safety data sheets, and train workers on safe handling procedures. Yet more than four decades after its adoption, HazCom remains one of OSHA’s most frequently cited workplace safety standards, indicating persistent compliance gaps across industries and regions.
To identify where U.S. employers are failing to warn workers about chemical dangers, Trace One—an SDS, regulatory compliance, and PLM software company serving the chemicals, food & beverage, and cosmetics sectors—analyzed OSHA enforcement data from 2021 through 2025. The analysis investigates which states and industries account for the most HazCom violations, as well as how these citation trends have evolved over time.
Here are the key takeaways from the analysis:
- HazCom violations remain widespread nationwide. OSHA recorded 36,984 Hazard Communication violations from 2021–2025, equal to 5.6 violations per 100,000 workers.
- Maryland leads the nation in total HazCom violations. There were 4,370 violations during the 2021–2025 period, equal to 39.0 violations per 100,000 workers, one of the highest rates in the country.
- Manufacturing and construction account for half of all HazCom violations. Manufacturing recorded 10,021 violations and construction reported 8,678, together making up 50.6% of all HazCom citations nationwide during the five-year period.
- Inspection rates vary significantly by industry. The construction industry is by far the most highly-inspected sector, accounting for 42.8% of all inspections.
- HazCom violations have declined substantially since their peak. Citations reached 37,134 in 1989 and fell to 6,130 in 2025, declining 83.5% over that period.
Which Industries Have the Most Hazard Communication Violations?
The manufacturing and construction industries account for more than half of all HazCom violations in the U.S.
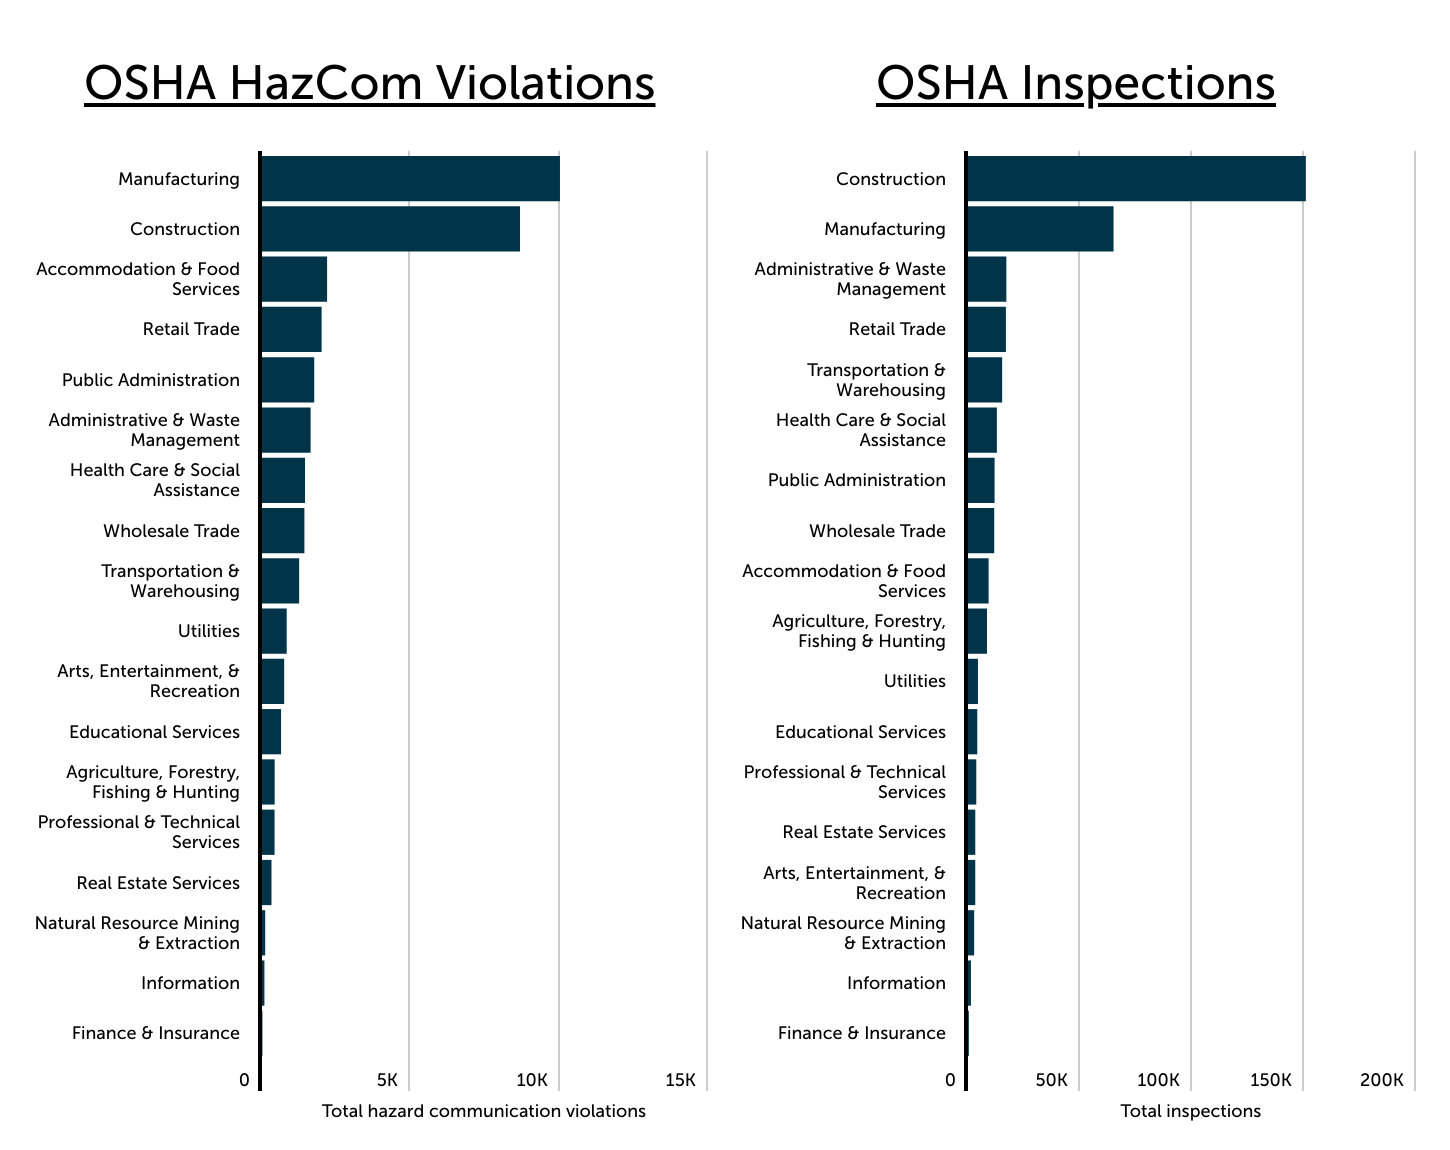
Source: Trace One analysis of Occupational Safety and Health Administration (OSHA) data
HazCom violations are heavily concentrated in a small number of industries. From 2021 to 2025, the manufacturing industry recorded 10,021 violations—the highest total of any sector—followed by the construction industry with 8,678 violations. Together, these two sectors account for 50.6% of all HazCom violations nationwide during the five-year period. The next tier of industries reported significantly lower totals, including Accommodation & Food Services (2,189 violations), Retail Trade (2,005), and Public Administration (1,756), while sectors with less frequent exposure to chemical hazards, such as Finance & Insurance (13) and Information (81), recorded comparatively few citations.
Inspection totals provide additional context. OSHA does not inspect workplaces solely on a fixed schedule. Instead, the agency prioritizes inspections based on imminent danger situations, severe injuries or fatalities, and formal complaints—many of which originate from employees or labor representatives. In addition, 22 states and jurisdictions operate OSHA-approved State Plan programs that conduct their own inspections and share enforcement data with federal OSHA.
From 2021 to 2025, OSHA conducted 150,832 inspections in construction, more than twice the 64,971 inspections in manufacturing, reflecting construction’s size and risk profile. Yet despite this heightened scrutiny, only 2.5% of construction inspections resulted in at least one HazCom violation—one of the lowest rates among major industries. By contrast, 8.8% of manufacturing inspections led to a violation, suggesting that while construction is inspected more frequently, manufacturing inspections are more likely to uncover HazCom deficiencies.
Where Are Hazard Communication Violations Occurring?
Maryland leads the U.S. in HazCom violations with 4,370 from 2021 to 2025
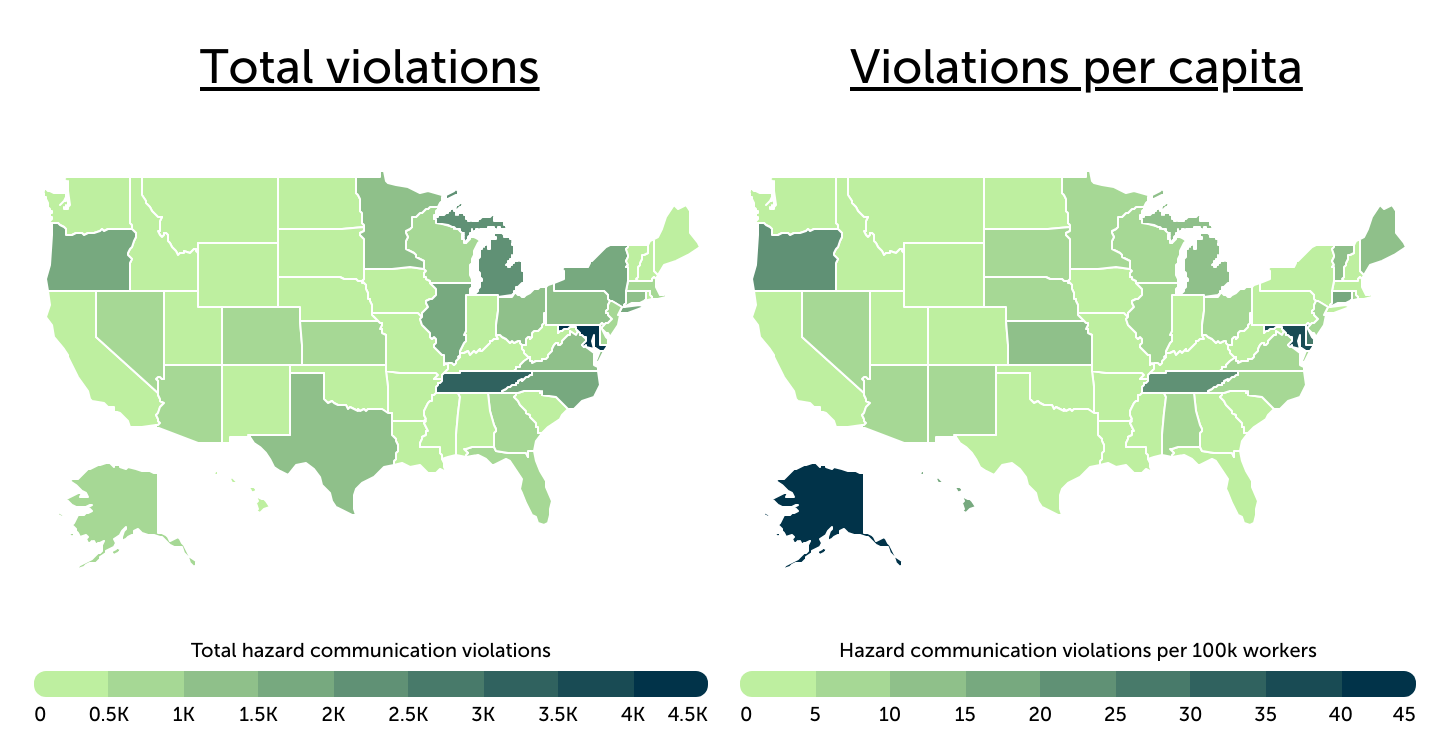


Source: Trace One analysis of Occupational Safety and Health Administration (OSHA) and U.S. Bureau of Labor Statistics data
HazCom violations are not evenly distributed across the country. Maryland recorded the most violations (4,370), followed by Tennessee (3,159) and Michigan (2,113)—states with substantial manufacturing and construction activity, the two industries that account for more than half of all HazCom citations nationwide. Michigan and Tennessee rank among the nation’s leading manufacturing states, particularly in motor vehicle production and advanced manufacturing. Maryland’s elevated totals align more closely with its significant construction sector, supported in part by defense-related infrastructure spending and federal contracting around the Washington, D.C. region, where the federal government is a major economic driver.
When adjusted for workforce size, the geographic landscape shifts. Alaska records the highest rate at 44.7 HazCom violations per 100,000 workers, followed by Maryland (39.0) and Delaware (26.5), while Tennessee (22.2) and Oregon (21.5) also rank among the highest on a per-worker basis. Because OSHA inspections are often complaint-driven or targeted rather than uniformly distributed across all workplaces, measuring violations on a per-worker basis provides a clearer view of enforcement intensity relative to a state’s labor force size. In smaller states such as Alaska and Delaware, concentrated industrial activity within a relatively small workforce can translate into elevated violation rates, even when total citation counts are lower than those in larger manufacturing states. Conversely, a populous state like California with a vast and diverse workforce only has 0.3 HazCom violations per 100,000 workers.
How Are Hazard Communication Violations Trending?
After peaking in 1989, HazCom violations have been declining ever since
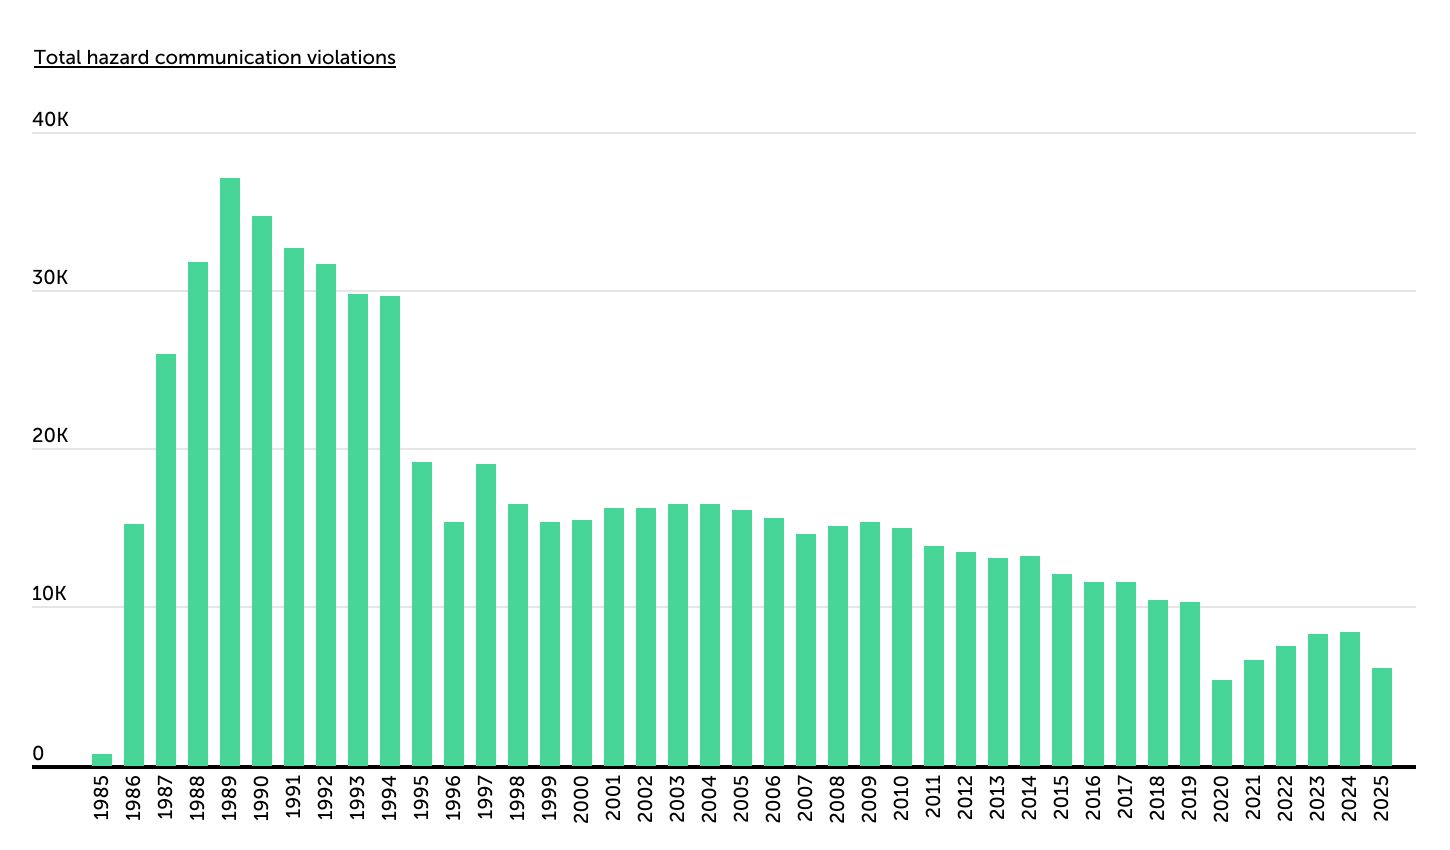
Source: Trace One analysis of Occupational Safety and Health Administration (OSHA) data
HazCom violations peaked at 37,134 citations in 1989, shortly after OSHA’s Hazard Communication Standard—first issued in 1983—was fully implemented and expanded to cover most private-sector employers. The rule was adopted to address widespread worker exposure to hazardous chemicals without consistent labeling, safety data sheets (SDS), or training requirements. Aside from a pronounced decrease in 1995—when the Clinton administration shifted OSHA to emphasize cooperative programs and reduce regulatory burden—annual HazCom violations remained relatively flat through the early 2000s.
More recently, 6,130 HazCom violations were recorded in 2025, representing a decline of 83.5% from the 1989 peak. While enforcement levels remain far lower than the decades prior, thousands of citations are still issued annually. The broader adoption of digital compliance systems—including automated Safety Data Sheet (SDS) management platforms that centralize chemical inventories, update hazard classifications, and standardize labeling—has likely contributed to improved documentation accuracy and regulatory alignment, helping large employers reduce compliance gaps over time.
Here is a summary of the data for New Hampshire:
- HazCom violations per 100k workers: 1.9
- Total HazCom violations: 57
- Share of inspections with a HazCom violation: 1.4%
- Total HazCom violation penalties: $53,105
- Most common HazCom violation: Missing chemical safety training
- Most common industry for HazCom violations: Manufacturing
For reference, here are the statistics for the entire United States:
- HazCom violations per 100k workers: 5.6
- Total HazCom violations: 36,984
- Share of inspections with a HazCom violation: 5.5%
- Total HazCom violation penalties: $32,393,120
- Most common HazCom violation: No written safety plan
- Most common industry for HazCom violations: Manufacturing
For more information, a detailed methodology, and complete results, see Where U.S. Employers Fail to Warn Workers About Chemical Dangers on Trace One.


(0) comments
Welcome to the discussion.
Log In
Keep it Clean. Please avoid obscene, vulgar, lewd, racist or sexually-oriented language.
PLEASE TURN OFF YOUR CAPS LOCK.
Don't Threaten. Threats of harming another person will not be tolerated.
Be Truthful. Don't knowingly lie about anyone or anything.
Be Nice. No racism, sexism or any sort of -ism that is degrading to another person.
Be Proactive. Use the 'Report' link on each comment to let us know of abusive posts.
Share with Us. We'd love to hear eyewitness accounts, the history behind an article.