


Six months ago the Monitor started taking a weekly look at select COVID-19 measurements for a simple reason: We were confused.
Everything was changing so fast, with public health officials telling us numbers every day about sickness and disease and things we’d never heard of, like PCR tests and positivity rates, that it was hard to tell if things were going badly or going well, getting better or getting worse.
We thought it would help us if we kept track of a few figures, week after week, rather than just giving out daily numbers, to provide a sort of thumbs-up or thumbs-down as the pandemic progressed. Judging from reader reaction many of you found it helpful as well, combined with online charts we’ve maintained about new cases, hospitalizations, and COVID-related deaths as part of ongoing coverage of the disease.
As we head into Pandemic Year Two, some things have changed – most importantly the arrival of vaccines, a bright spot amid the dismay — but uncertainty remains. Have things gotten better or worse during the past week? Should I be more worried or can I relax a bit?
With that in mind, we’re going to continue the COVID Tracker every Monday as part of our ongoing coverage. We’re making a few changes in the format and will probably make more changes as the weeks go by, especially when vaccinations become more widespread and that data becomes more significant.
With any luck, by the summer we’ll be able to wind up the whole project because the pandemic will be coming under control. Keep your fingers crossed. And your mask on.
Note that the Monitor’s COVID Tracker will continue using a two-week running average for many statistics instead of the one-week average used by the state and most news organizations. We think it does a better job of smoothing out fluctuations in daily reporting. This difference explains why sometimes other places, such as the New York Times, will say New Hampshire is improving when we say it isn’t, or vice versa.
Number of new cases — what’s the trend? Getting better but still way too high.
The two-week average of new cases rose sharply for two months and peaked around Dec. 20, three weeks after all the Thanksgiving travel. Since then it has slipped from 855 to 745. That’s a good trend but the figure is still seven times higher than it was during the spring pandemic.
Note that this measure is slightly misleading because it uses the daily Department of Health and Human Services report of new positive test results, many of which come from tests that had been given several days previously. But it’s the best measure we’ve got.
Number of hospitalizations — what’s the trend? Very high and rising slightly.


Before mid-December, New Hampshire had never had more than 250 people in the hospital with COVID-19. Since then we’ve never had fewer, and the figure has been around 300 recently.
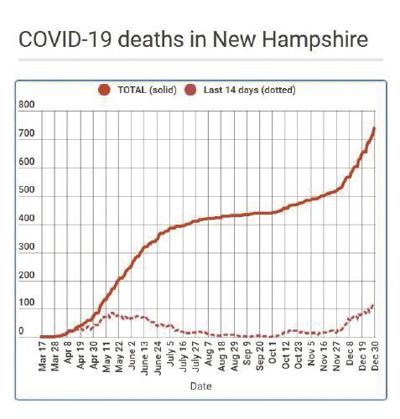
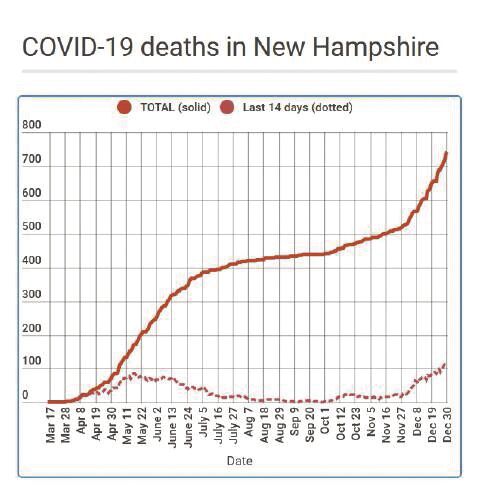
Number of deaths — what’s the trend? Going up again.
The number of New Hampshire residents who die with COVID-19 has quadrupled this month, from slightly less than 2 each day at the start of the month to about 8 a day as of Dec. 30. As before, almost all of these are occurring in our elderly population.
PCR test positivity rate — what’s the trend? Too high and edging up.
This has always been a confusing figure because it reflects two independent variables: How many tests are given and how much virus is out there. A high positivity rate might mean the virus is spreading or it might mean we’re not testing enough, or both.
However, since the number of PCR tests given has for months been well above an accepted minimum of 150 per 100,000 people each day, which is why the Tracker has stopped recording it each week. As a result, we will use test positivity rate as a rough measure of the likelihood that a given person on the street is infected. That’s not clinically exact but seems reasonable.
Before late November, the positivity rate on any given day was almost never above 5%, a commonly used guideline to reflect whether the virus is spreading widely. Since then it has almost never been below 5%. Worse, it is moving higher: The two-week average went from 5.9% the week before Christmas to 6.4% on New Year’s Eve.
As much as any single measurement on this list, that trend indicates that SARS-CoV2, the virus that causes COVID-19, is not only spreading but spreading more quickly through the Granite State. That’s bad news, especially since, as far as we know, the new mutation that makes the virus more contagious has not arrived here yet.
(David Brooks can be reached at 369-3313 or dbrooks@cmonitor.com or on Twitter @GraniteGeek.)
•••
These articles are being shared by partners in The Granite State News Collaborative. For more information visit collaborativenh.org.


(0) comments
Welcome to the discussion.
Log In
Keep it Clean. Please avoid obscene, vulgar, lewd, racist or sexually-oriented language.
PLEASE TURN OFF YOUR CAPS LOCK.
Don't Threaten. Threats of harming another person will not be tolerated.
Be Truthful. Don't knowingly lie about anyone or anything.
Be Nice. No racism, sexism or any sort of -ism that is degrading to another person.
Be Proactive. Use the 'Report' link on each comment to let us know of abusive posts.
Share with Us. We'd love to hear eyewitness accounts, the history behind an article.